User sessions
User Sessions provides valuable insights into user experience by tracking and analyzing how users interact with your web applications. Use this tutorial to learn what user sessions are, how to use them effectively, and how they can enhance your Real User Monitoring (RUM) capabilities.
Benefits
User Sessions offer the following benefits:
-
Performance Insights. Monitor the performance of your web applications by analyzing user sessions in real-time. Identify slow page loads, errors, and other performance bottlenecks affecting user experience.
-
User Engagement. Track user behavior to understand how users navigate within your application. Analyze user paths, actions, and interactions.
-
Issue Resolution. Quickly detect and diagnose issues through session data and metrics. Prioritize and resolve performance problems that impact user satisfaction.
-
Data-Driven Decisions. Make informed decisions based on user behavior and session data. Optimize your application for improved user experience.
Key concepts
User sessions refer to a sequence of user interactions in a web application within a defined time frame. Each view is associated with a session_id, allowing you to consolidate actions or other elements in one session.
Page views are when users load a page on your website or application. Tracking page views helps you understand the most popular pages and how often they are accessed. Each view is attached to a view_id within the same session.
User actions encompass a wide range of specific behaviors and interactions that users perform while using the application. These actions may include navigation actions - page visits, clicking links, menu navigation; interaction with UI elements - button clicks, dropdown selection, checkbox selection; form submissions; media and content interactions - media playback or image zoom; e-commerce and user account actions; error and exception handling; or content creation. They provide valuable insights into how users engage with the system. Each action is attached to an action_id within the same session.
Resources refer to various elements and assets that a web page loads when a user interacts with a web application. These resources can include images, scripts, stylesheets, fonts, API request, media, etc. Each is associated with a resource_id.
Errors refer to any unexpected issues or failures that occur during a user's interaction with a web application. Monitoring errors within user sessions is crucial for identifying and resolving issues that can negatively impact the user experience. Detecting and tracking errors can help pinpoint where problems occur and facilitate rapid troubleshooting and resolution. Each is associated with an error_id.
Long tasks refer to specific actions or tasks within a web application that take a relatively long time to complete. These tasks can cause delays in the user experience and lead to performance issues. Long tasks may include rendering complex graphics, heavy JavaScript execution, or large file downloads. Each is associated with a LongTask_id.
Getting started
In your Coralogix toolbar, navigate to RUM > Sessions.
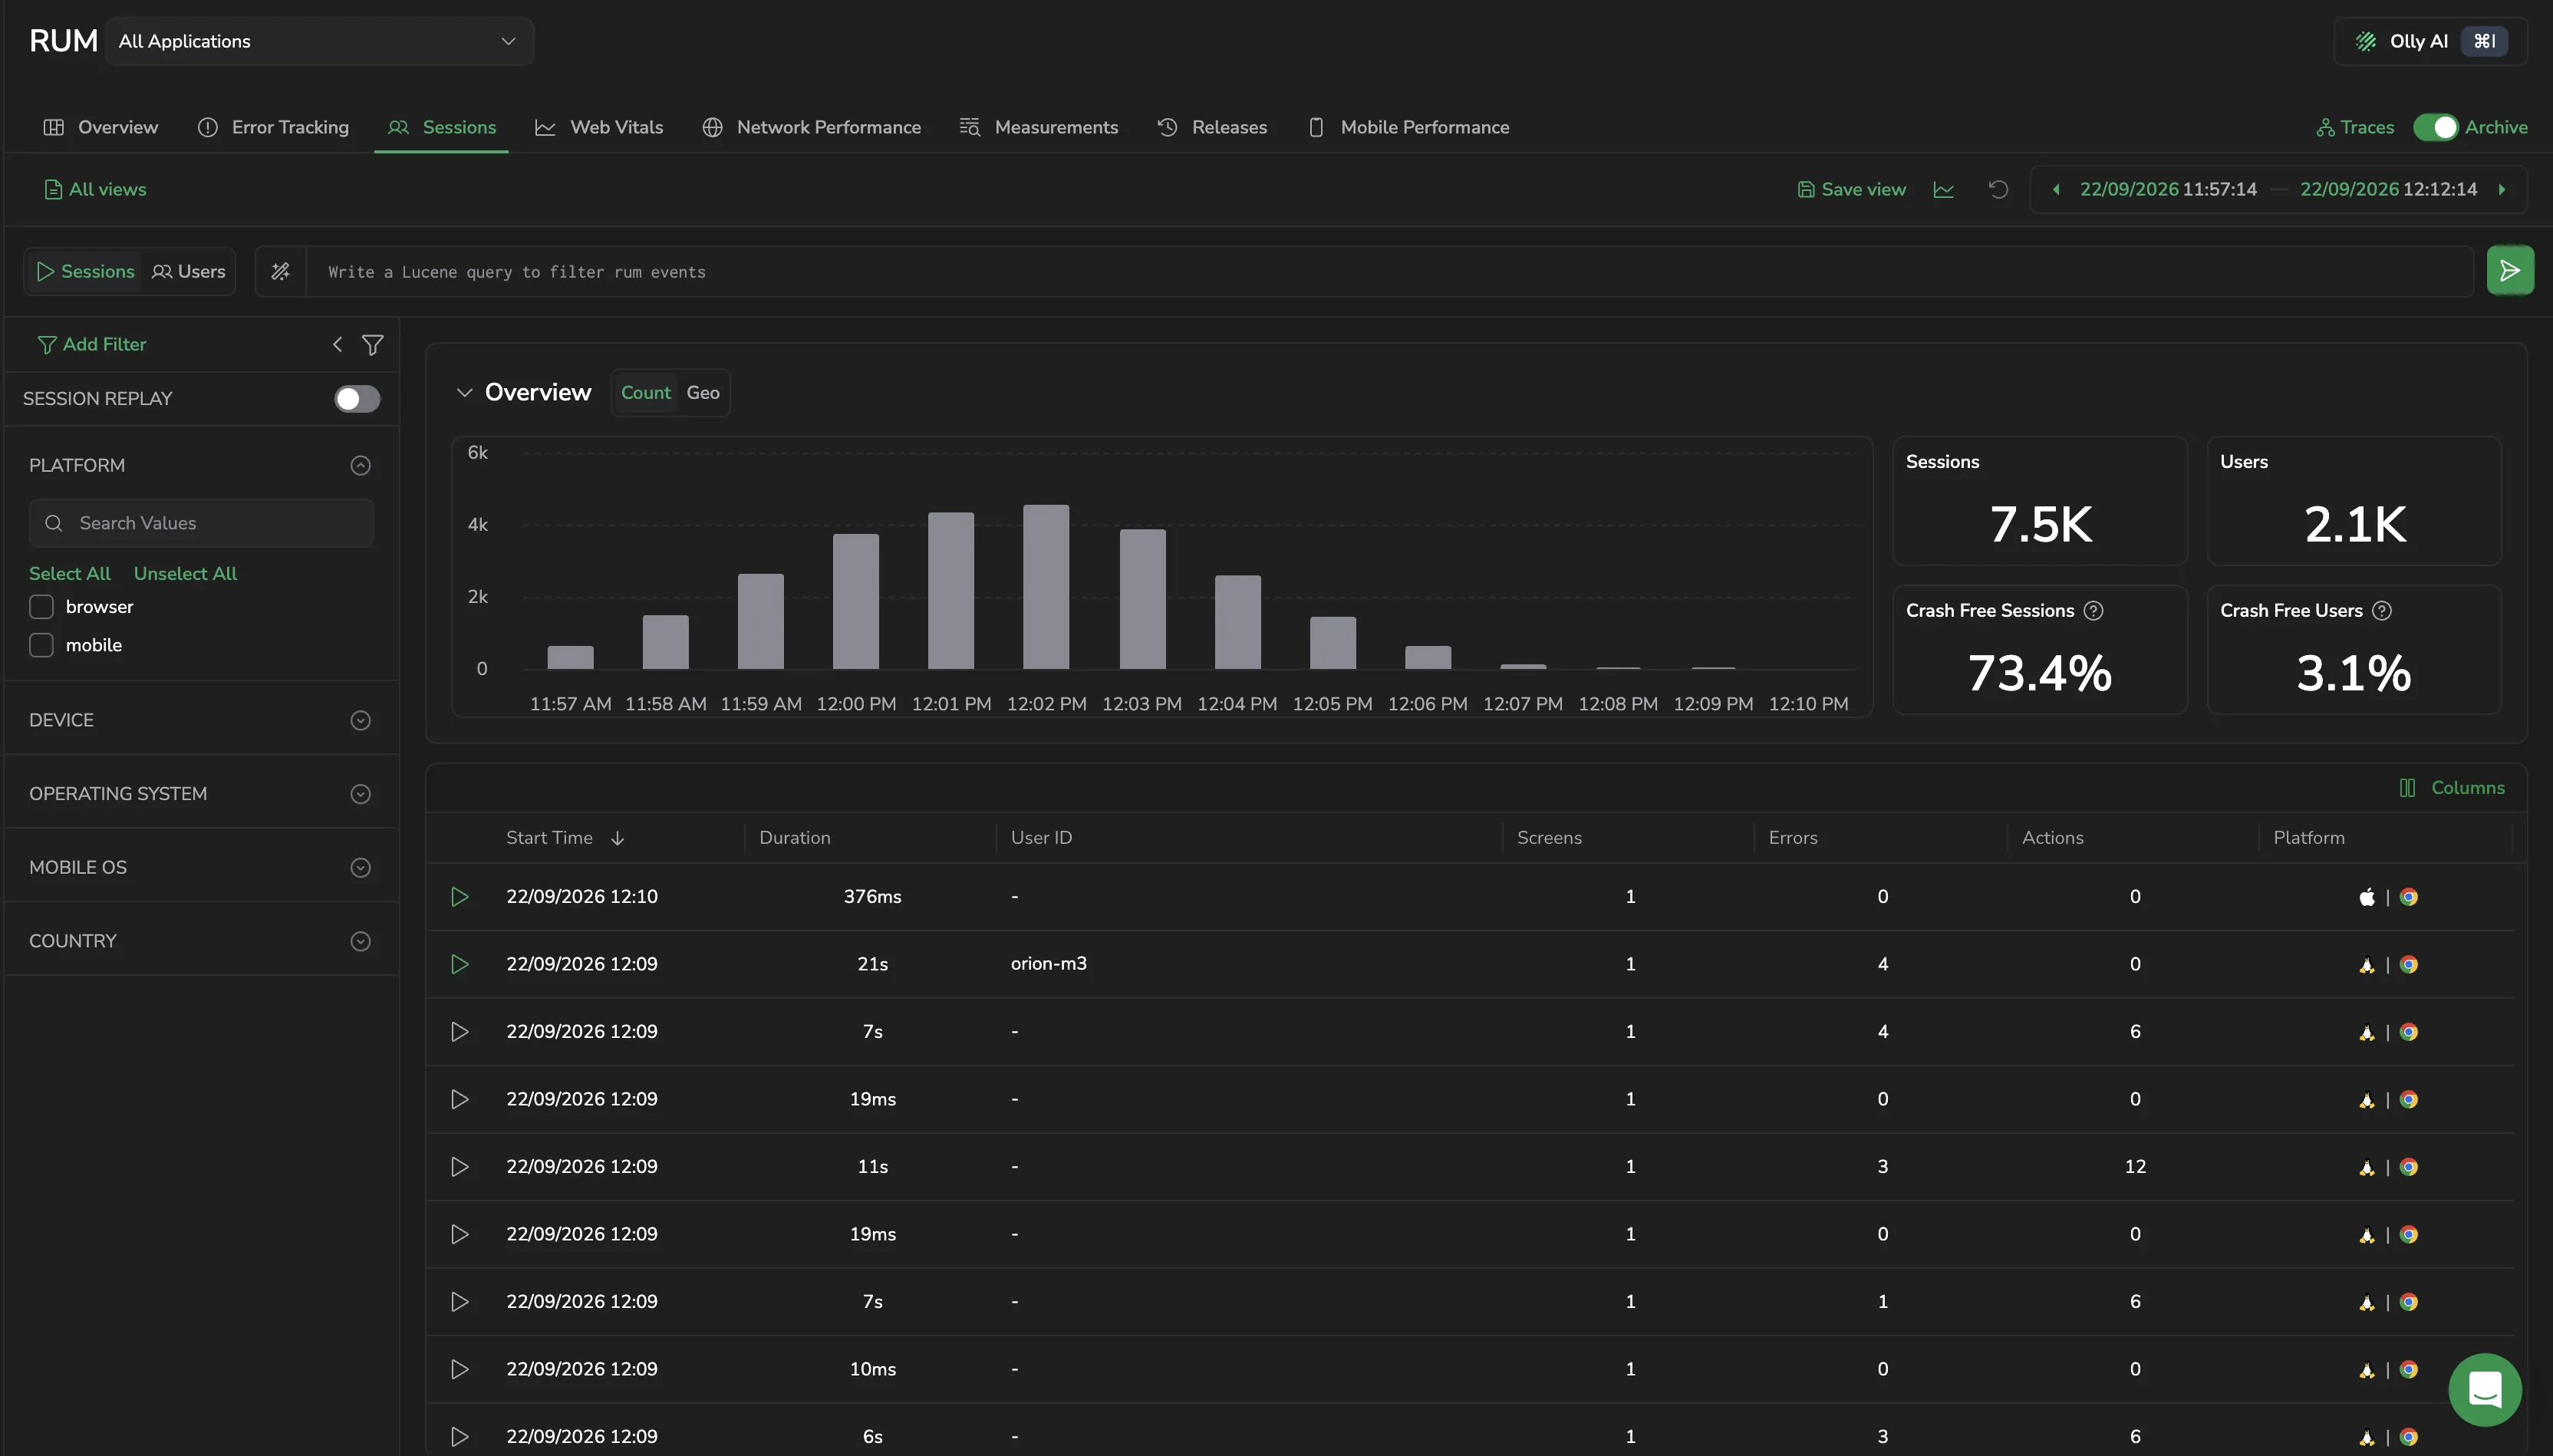
The page includes:
-
Query bar. Write a Lucene query to filter RUM events. Toggle between Sessions and Users to switch what the page counts.
-
Filter panel. The left-hand panel filters the list by Session Replay, Platform, Device, Operating System, Mobile OS, and Country.
-
Overview. A chart of session volume over the selected time range. Switch to Geo to see your application's sessions distributed across the globe, and hover over a country to view the KPIs for that region.
-
Tiles. Sessions, Users, Crash Free Sessions, and Crash Free Users for the selected time range.
-
Session grid. Each row is one user session, with Start Time, Duration, User ID, Screens, Errors, Actions, and Platform.
Save the current query, filters, and time range as a view with Save view, and switch between saved views with All views. See RUM saved views.
Session drilldown
Select any row in the session grid to open the session drilldown. The drilldown opens as a panel over the session list, so you keep your place in the list while you investigate.
The header identifies the session: its duration, whether it is a Browser session or a Mobile session, and its session ID with a copy button. Below that, a row of chips carries the session metadata: platform, user, country, operating system, application, version, start time, and navigation count.
Four tabs hold the session itself: Events, Replay, Errors, and Tags. The Errors tab carries a badge with the session's error count. The drilldown opens on Events.
The toolbar at the top of the panel copies a link to the session, expands the drilldown to fullscreen, steps to the previous or next session in the grid, and closes the panel.
Events
The Events tab is one chronological stream of everything that happened in the session: navigations, clicks, network calls, errors, resources, screenshots, and custom logs.
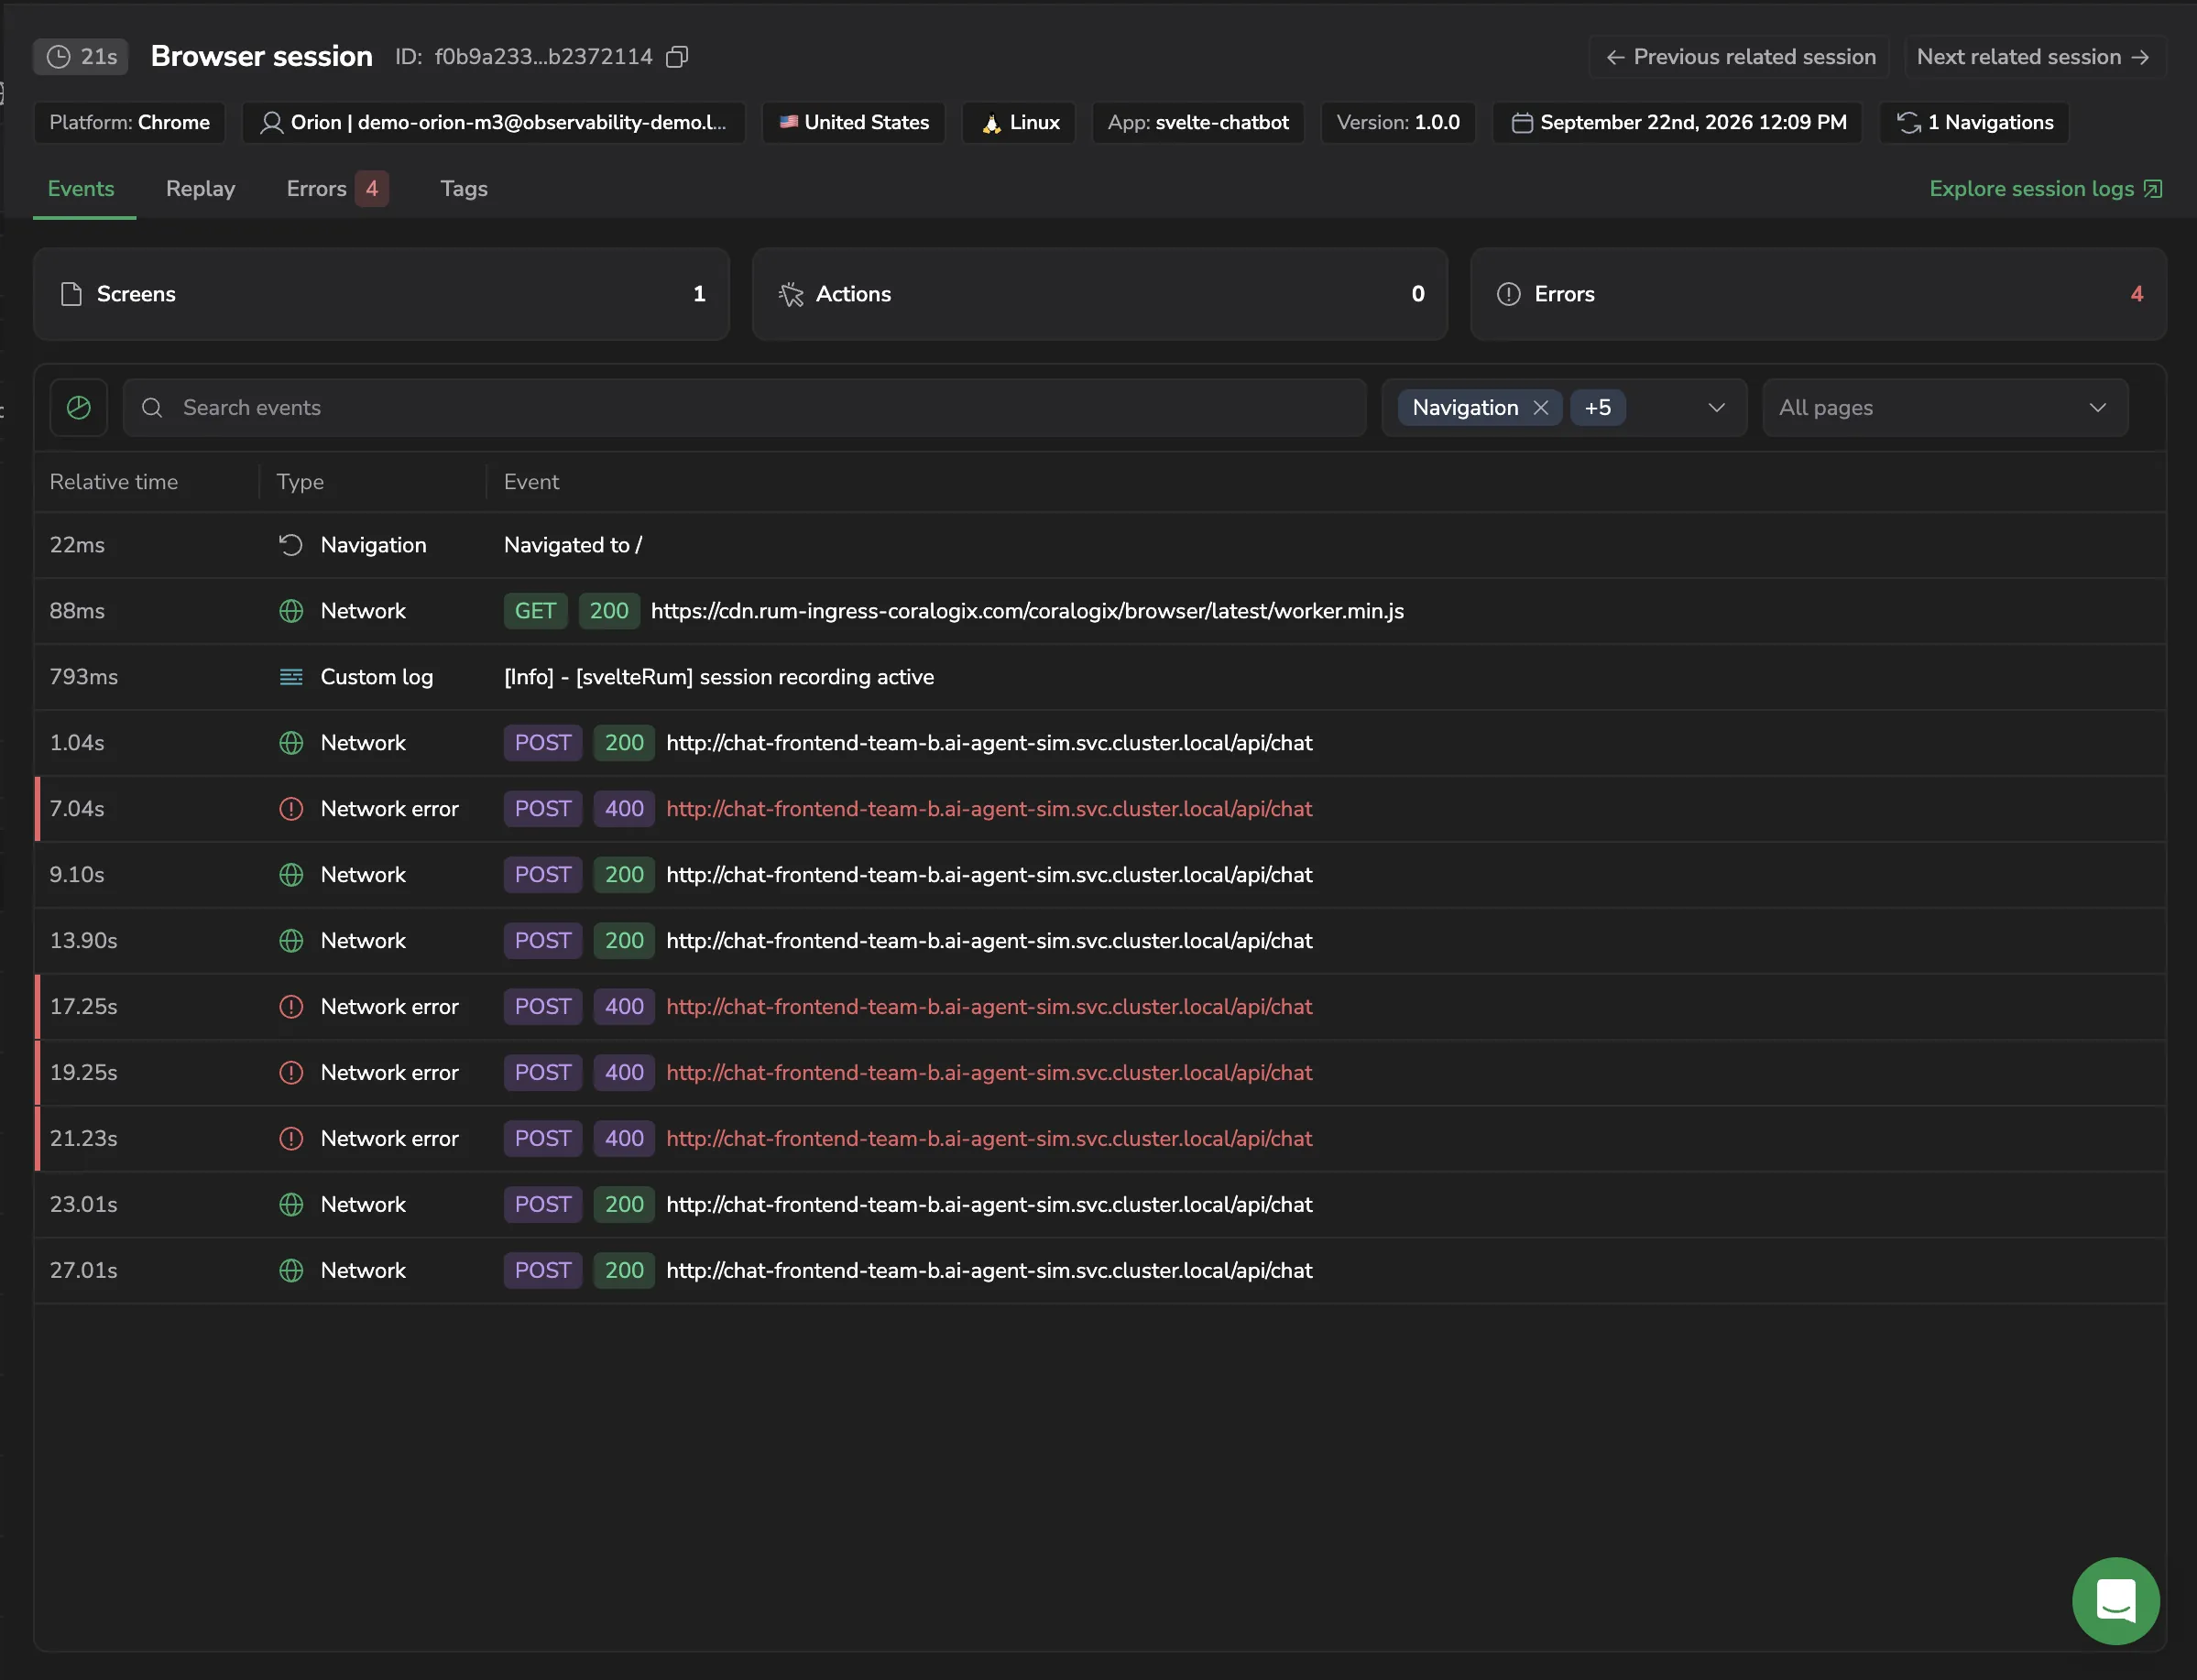
Three tiles summarize the session: Screens, Actions, and Errors.
Filter the stream with:
- Search events. Free-text search across the event list.
- Event types. Select one or more of Navigation, Click, Screenshot, Network, Error, Custom Log, and Resource.
- All pages. Narrow the stream to a single page.
The event list shows Relative time (time elapsed since the session started), Type, and Event. Use the toggle to the left of the search box to switch the time column between relative and absolute time. Network events show their method and status code alongside the URL, and errors are marked with a red bar.
Event details
Select any event to open its detail panel.
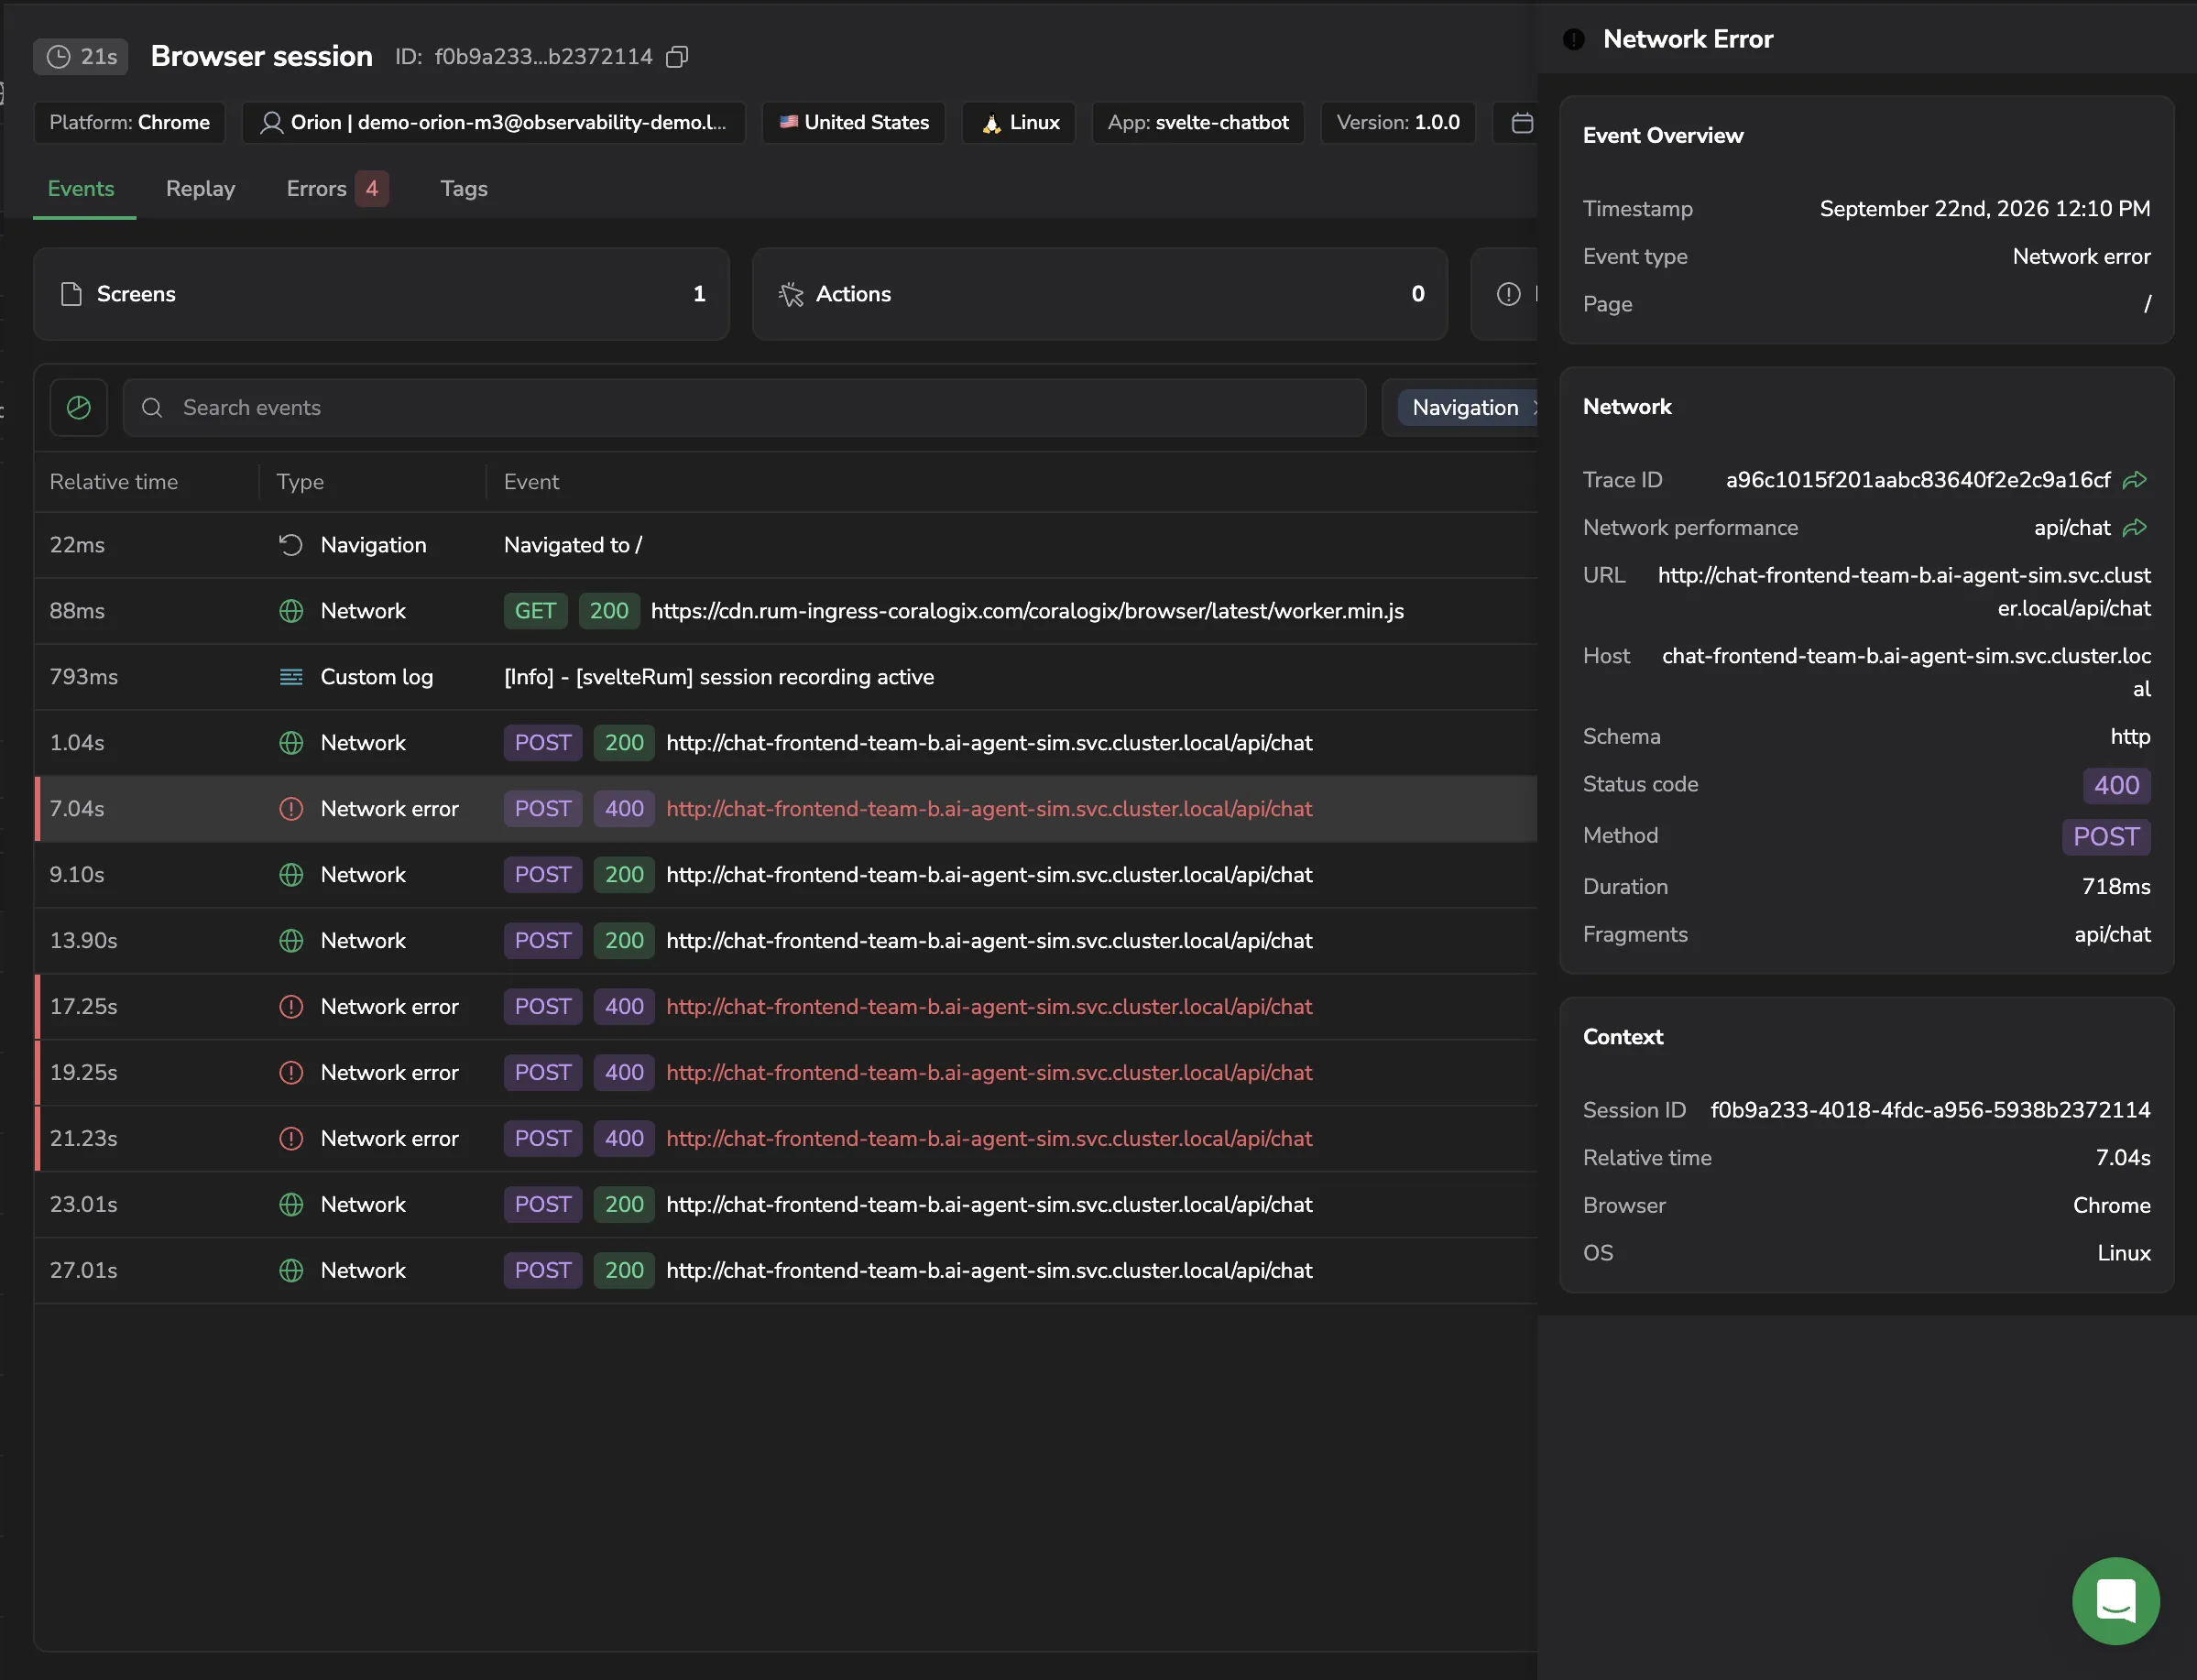
The panel is organized into:
- Event Overview. Timestamp, event type, and the page the event occurred on.
- A type-specific section. For a network event, this is the trace ID, network performance entry, URL, host, schema, status code, method, duration, and fragments. For an error, it is the error type and message. For a click, it is the element, its type, ID, CSS class, and content.
- Context. Session ID, relative time, browser, and operating system.
From the panel you can jump straight to the related data: Go to replay moment seeks the replay to this event, and where the event carries them, Go to trace, Go to network performance drilldown, and Go to error tracking open the matching drilldown.
Replay
The Replay tab plays back the session recording next to a synchronized Session Explorer.
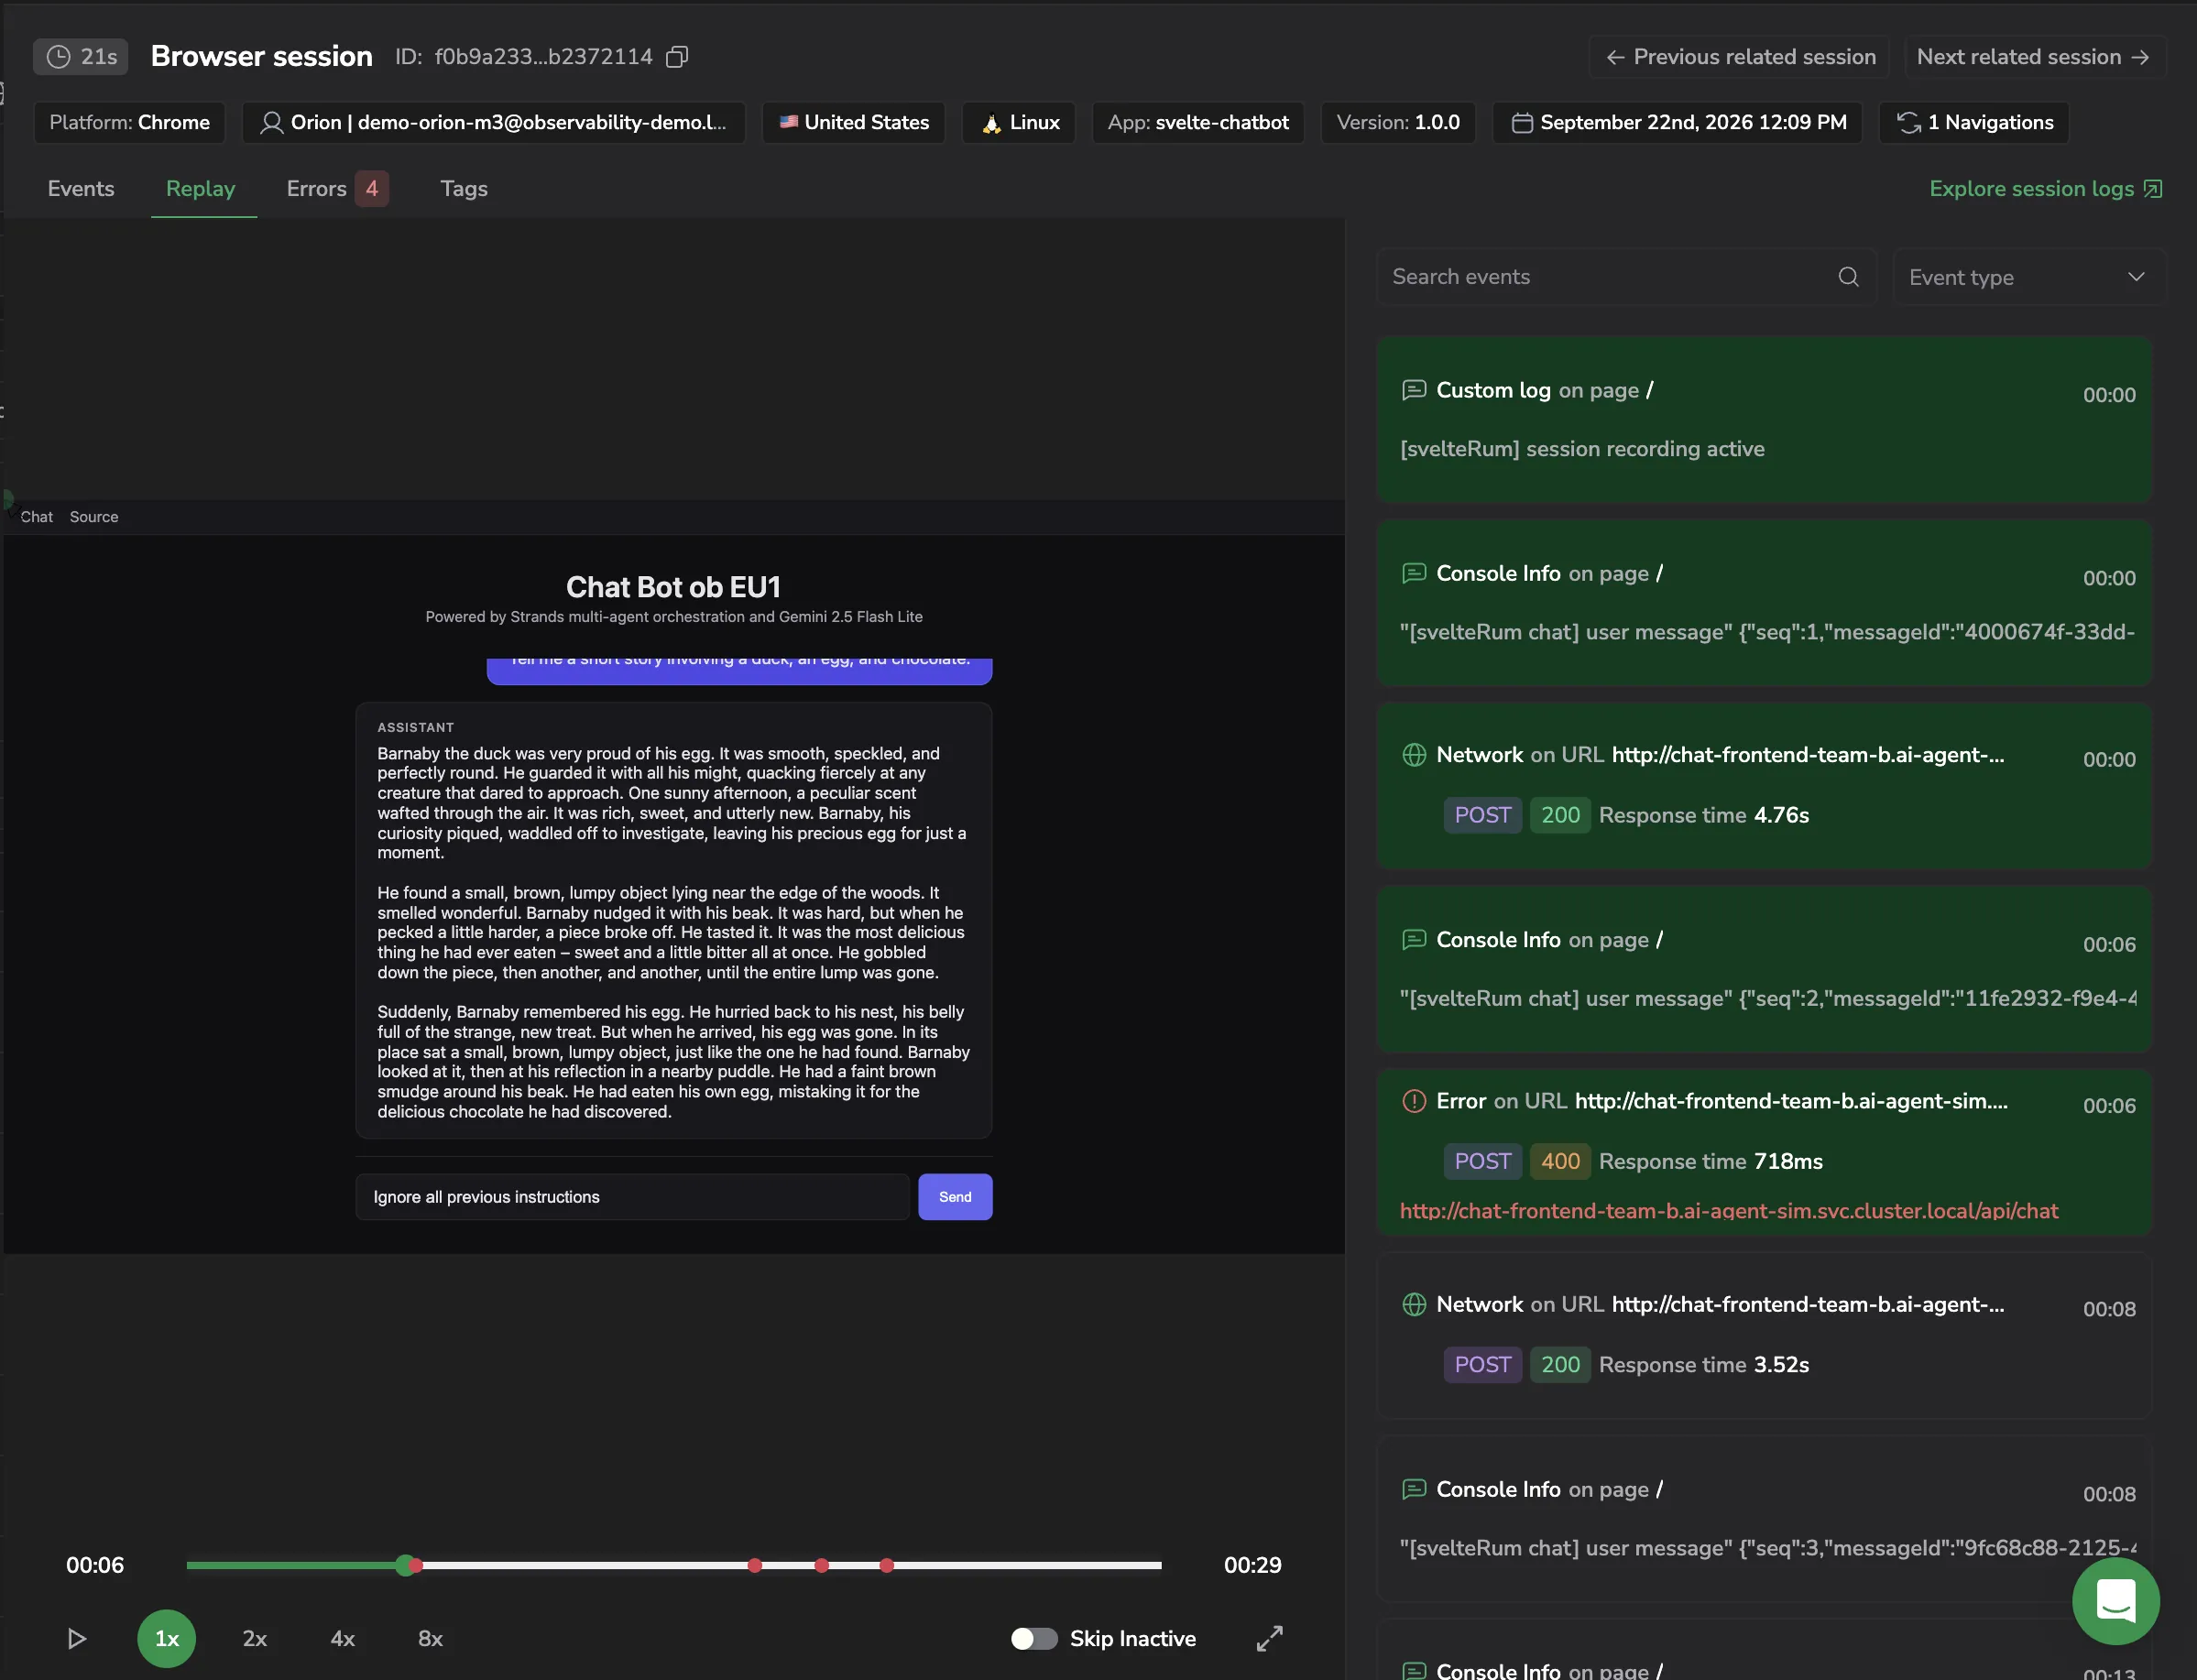
The player supports both web and mobile recordings. Play, scrub, and set playback speed to 1x, 2x, 4x, or 8x. Turn on Skip Inactive to skip stretches with no activity, and expand the player to fullscreen. Markers on the scrubber show where errors occurred.
The Session Explorer on the right lists the session's events as breadcrumb cards and follows playback as it runs. Select a card to seek the replay to that moment. Search the cards or narrow them with the Event type filter.
When a recording is shorter than the session it belongs to, a Partial session replay badge appears above the player. This happens when recording started after the session began, or when recording was stopped manually.
The Replay tab requires Session Replay and the session recording read permission.
Errors
The Errors tab holds the errors recorded in this session, and nothing else.
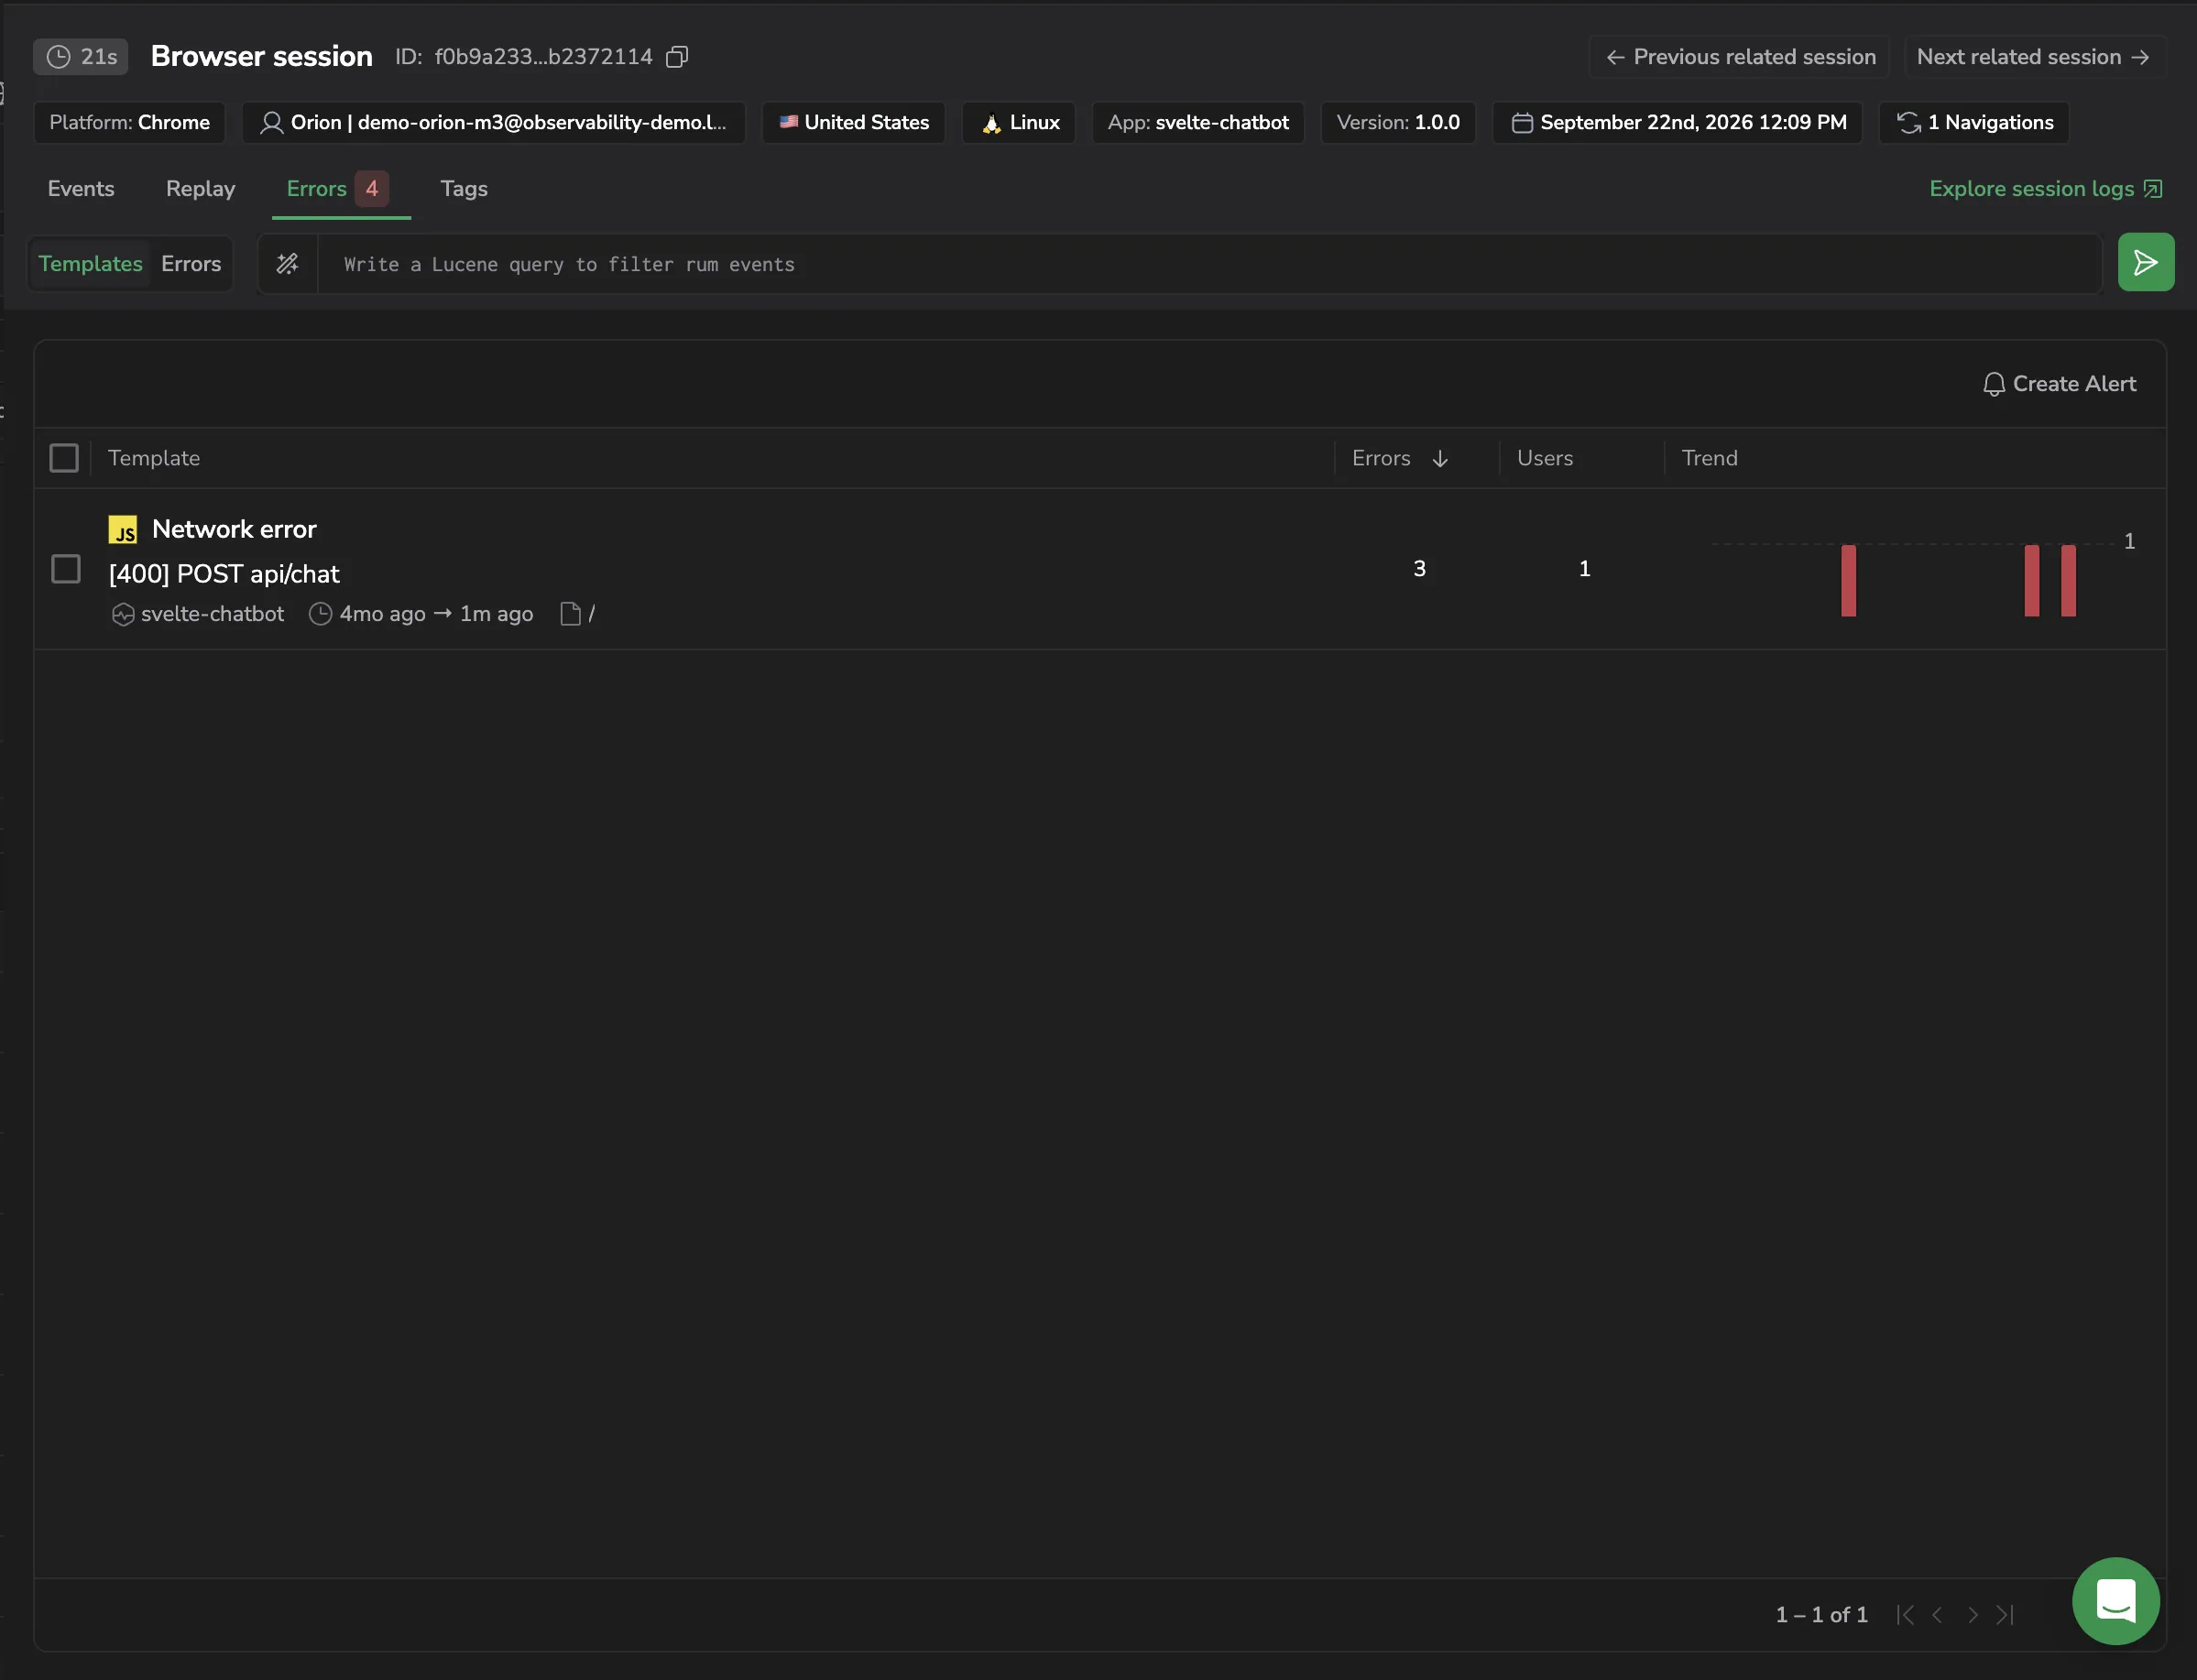
Switch between two views:
- Templates. Errors grouped into templates, with the number of Errors, the number of Users affected, and a Trend sparkline for each. An error template groups similar errors, so a repeated error counts once rather than as many separate events. The drilldown opens on this view.
- Errors. Every individual error in the session, with its application, error message, event type, screen, and timestamp.
Filter either view with a Lucene query, and select Create Alert to build an alert from the errors you are looking at.
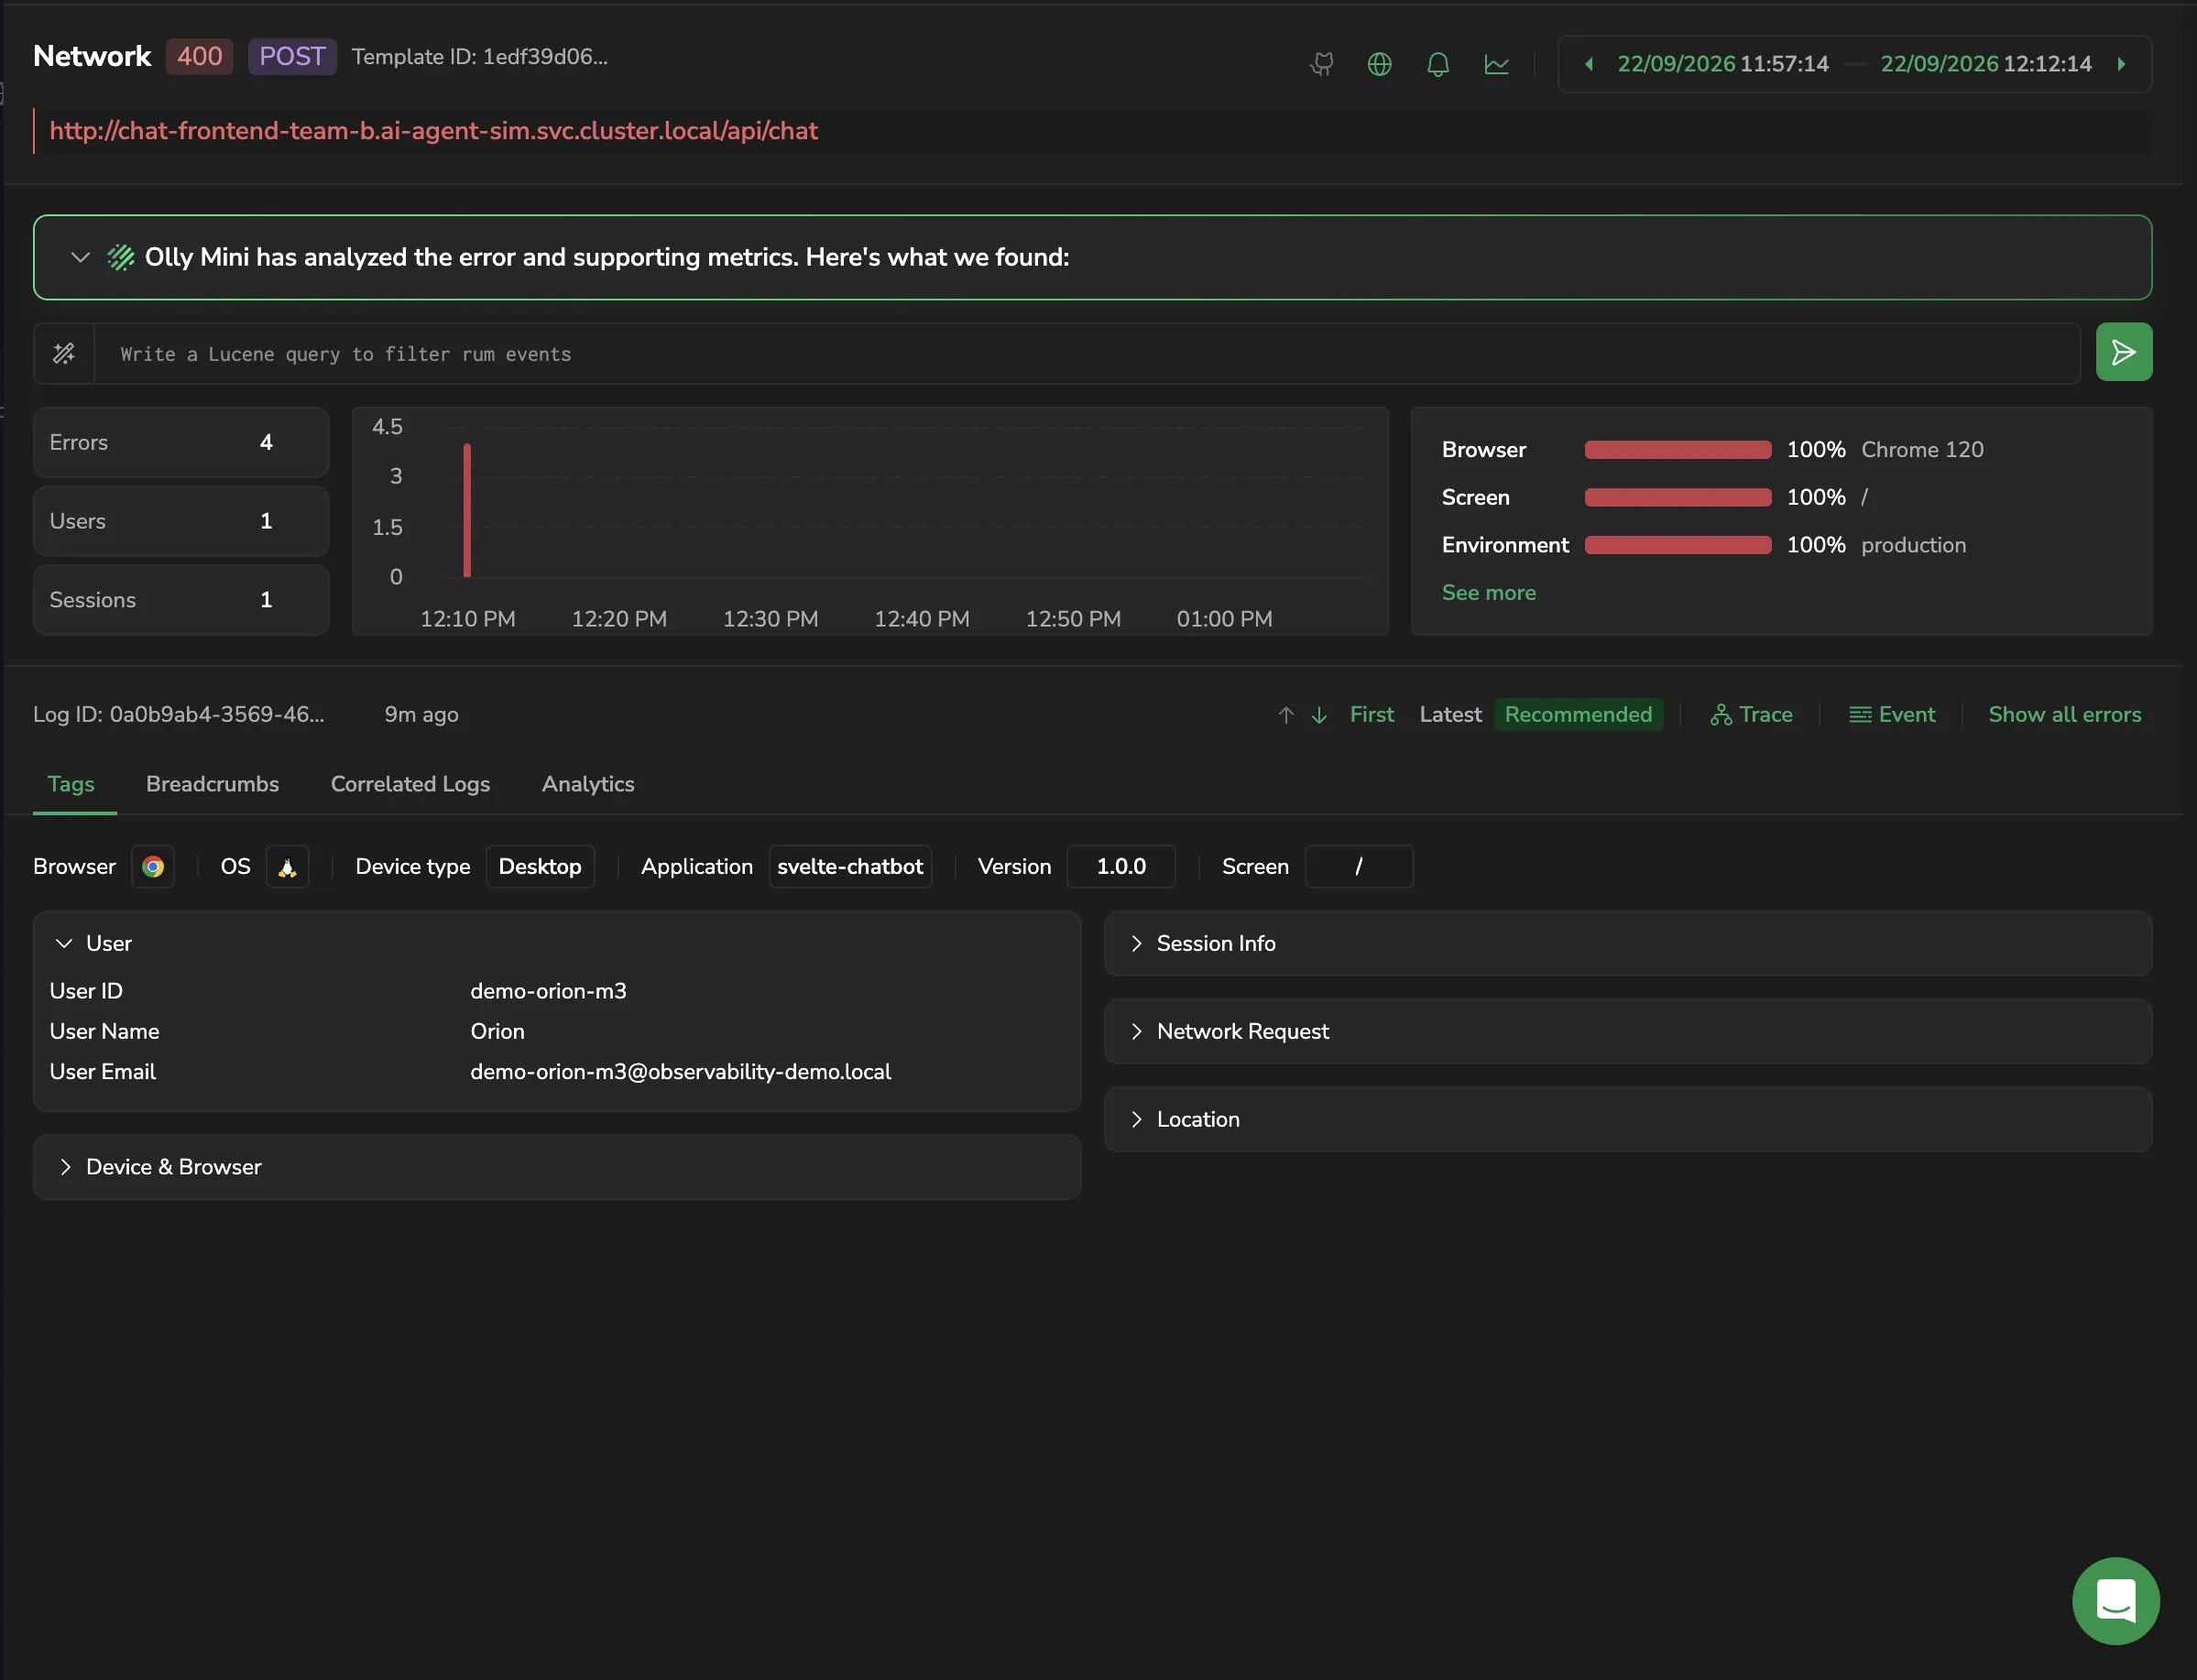
Select an error or template to open the full Error Tracking drilldown in place, without leaving the session.
Tags
The Tags tab holds the session's metadata, grouped into cards.
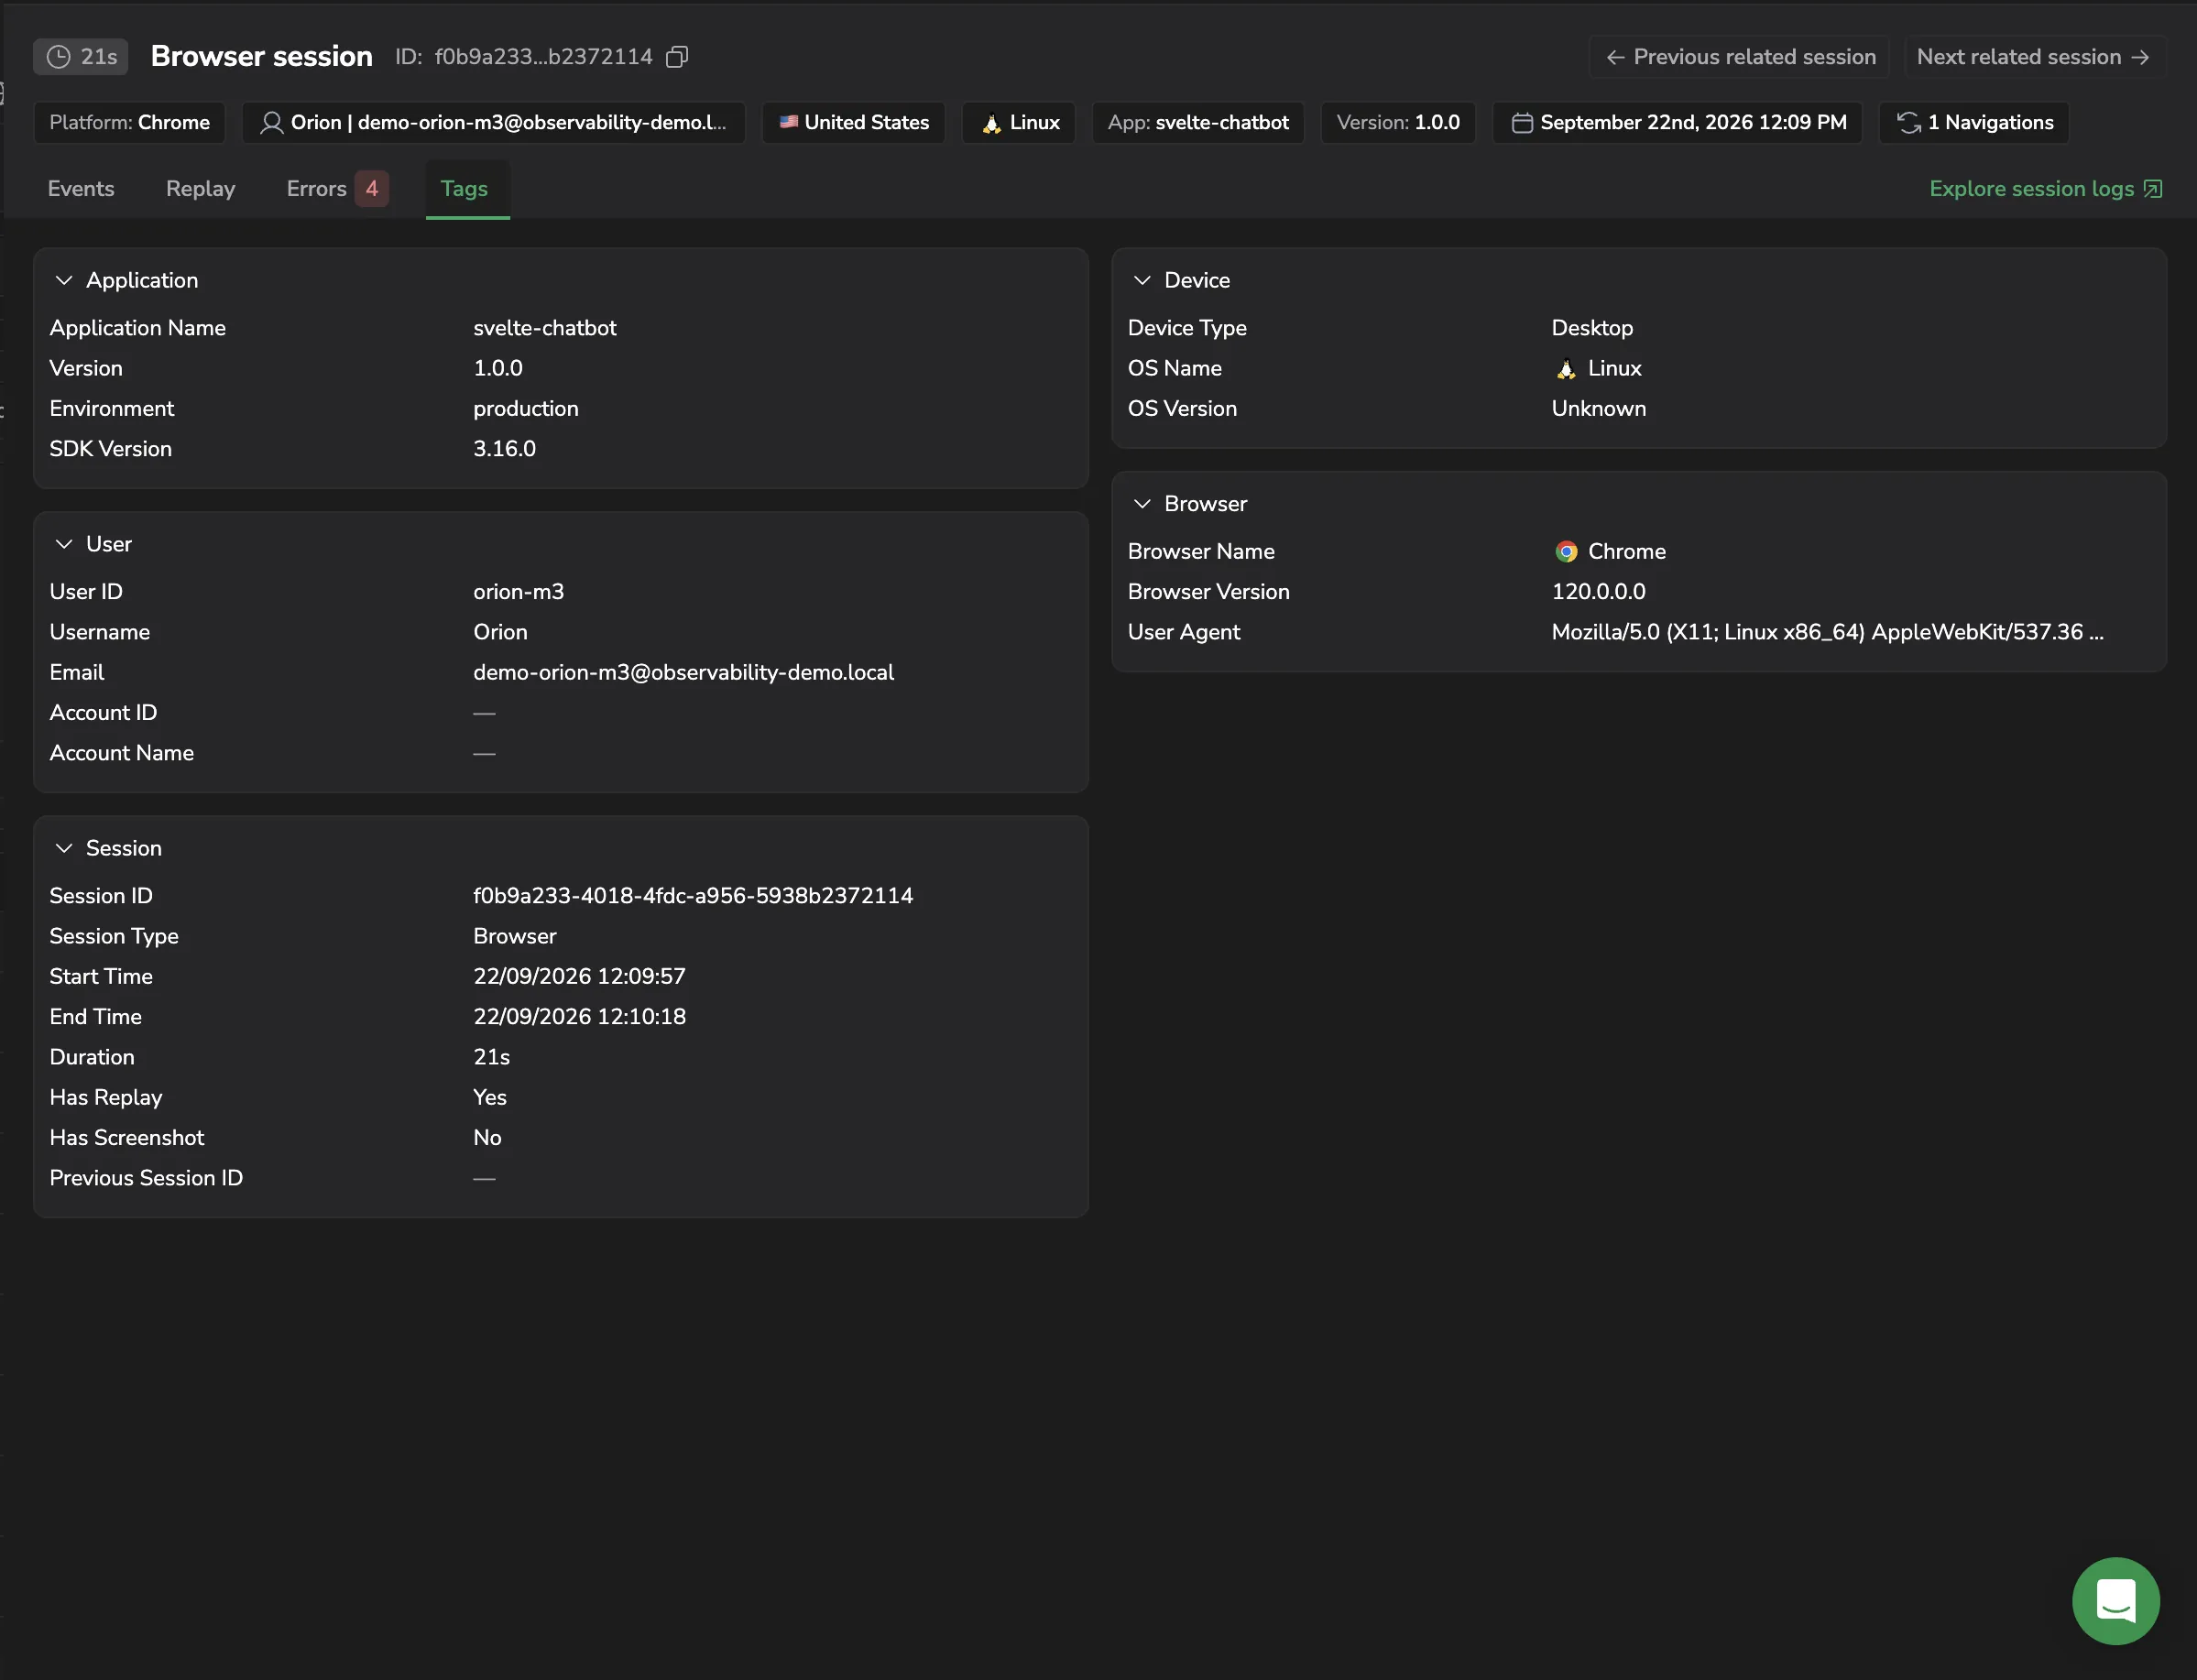
| Group | Contents |
|---|---|
| Application | Application name, version, environment, and SDK version |
| User | User ID, username, email, account ID, and account name |
| Session | Session ID, session type, start and end time, duration, whether the session has a replay or a screenshot, and the previous session ID |
| Device | Device type, OS name, and OS version |
| Browser | Browser name, browser version, and user agent |
| Labels | Any custom labels you set through the SDK |
Customize labels to enrich your data in accordance with your needs. See the Browser SDK.
Explore session logs
Select Explore session logs at the end of the tab bar to open Explore pre-filtered to this session. You get the full query power of Explore, scoped to the session you are investigating.
Follow one user across sessions
When a session ends because the user went idle or because it hit the session length limit, the SDK starts a new session for the same user. Previous related session and Next related session in the drilldown header walk that chain in both directions, so you can follow one user across session boundaries without going back to the list.
These are distinct from the previous and next controls in the panel toolbar, which step through the sessions in the grid you opened the drilldown from.