Kubernetes enrichment options
Host data
After connecting your Kubernetes clusters to Coralogix Infrastructure Explorer, enrich host metadata for the cloud instances running your clusters by following Getting started with host monitoring. The AWS Infrastructure Explorer integration ingests metadata for AWS EC2 instances, the Azure Infrastructure Explorer integration ingests metadata for Azure Virtual Machines and Virtual Machine Scale Set instances, and the GCP Infrastructure Explorer integration ingests metadata for Google Compute Engine instances.
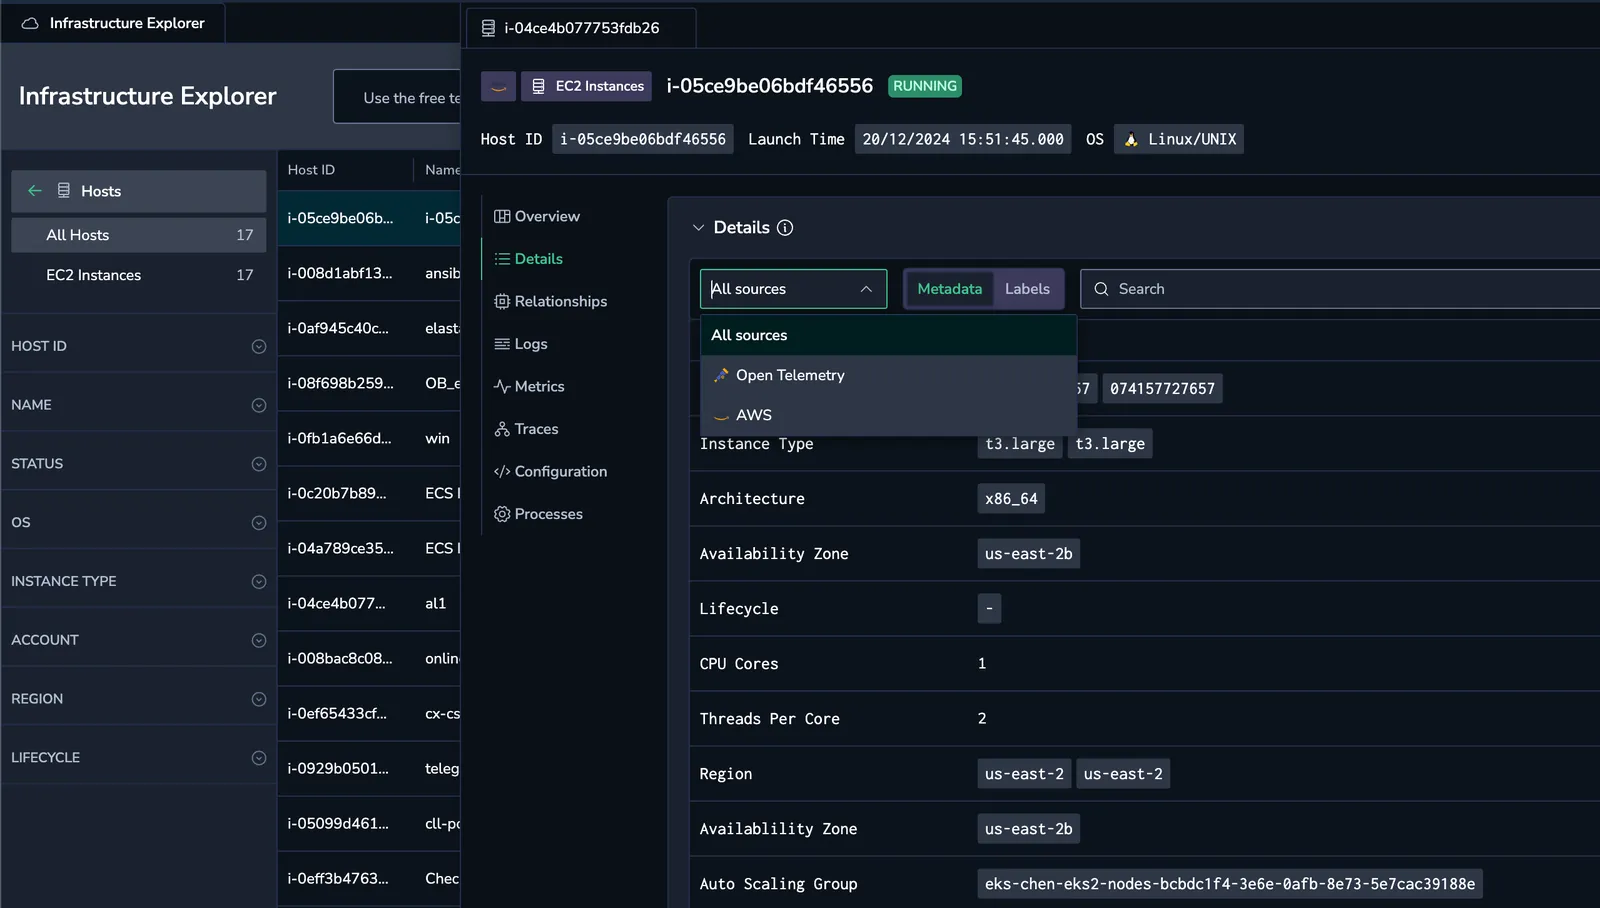
The example below shows how resource metadata appears before and after enrichment is enabled.
Before enrichment:
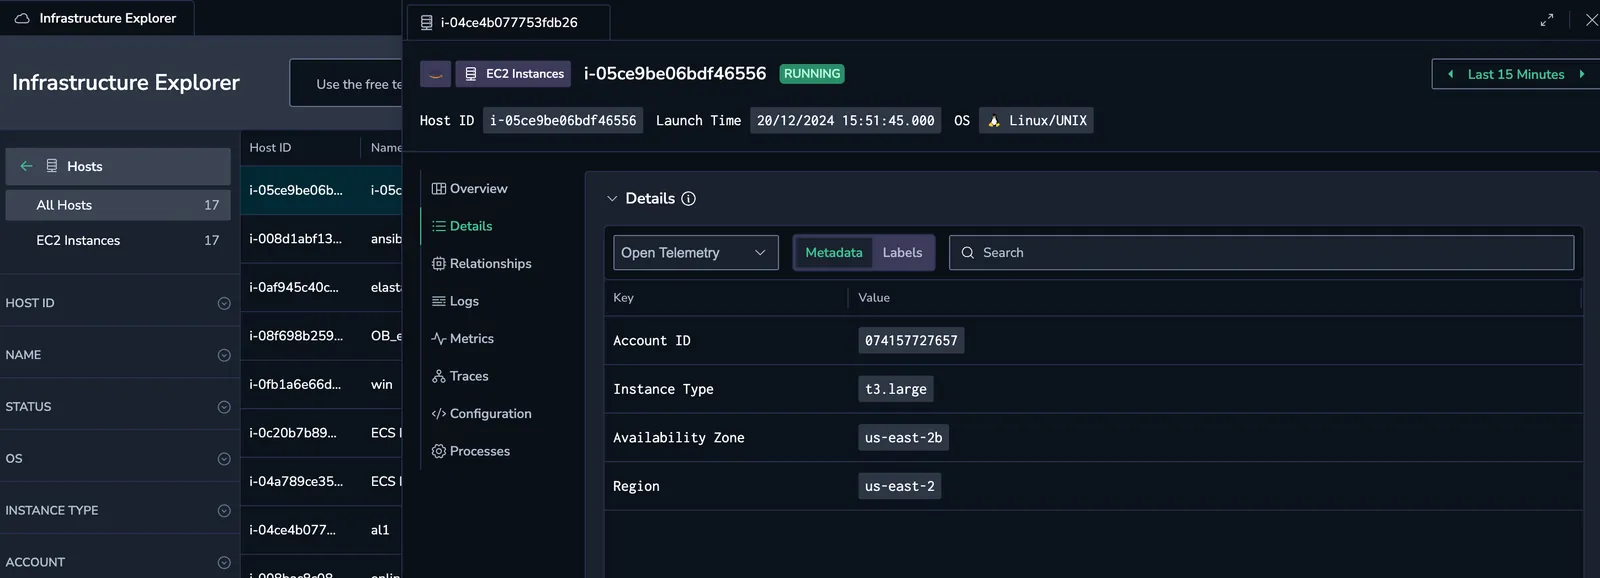
After enrichment:
Note: Metadata enrichment is supported for AWS EC2 instances, Azure Virtual Machines (including Virtual Machine Scale Set instances), and Google Compute Engine instances.
Host metrics
The hostMetrics preset is enabled by default in the Coralogix Kubernetes OpenTelemetry deployment. To add CloudWatch metrics to your dashboards, install the AWS CloudWatch Metrics Connector.
With the connector installed, CloudWatch metrics for hosts running your Kubernetes workloads become available:
- Metrics are collected every 10 minutes by default (increase the interval to reduce usage).
- Metric definitions are refreshed every 5 minutes.
If you require more frequent metric updates, use the Firehose-based integration for near real-time ingestion.
Host process
The Process preset, part of hostMetrics, is disabled by default. To enable it, update your OpenTelemetry agent configuration as shown below:
Find more details in the advanced agent configuration guide. Once enabled, host process data will be available in the Process tab of your host dashboard.
Send application telemetry to the Coralogix agent
In addition to infrastructure data, send application logs, metrics, and traces to the Coralogix agent running on each Kubernetes node.
Step 1: Set up the Kubernetes Complete Observability integration
Follow the Kubernetes Complete Observability integration setup guide to deploy the required components.
Step 2: Configure your applications to export telemetry
Add the following environment variables to your application deployments to direct telemetry to the node-local agent:
- name: NODE_IP
  valueFrom:
    fieldRef:
      fieldPath: status.hostIP

- name: OTEL_EXPORTER_OTLP_ENDPOINT
  value: "$(NODE_IP):4317"

- name: OTEL_EXPORTER_OTLP_PROTOCOL
  value: "grpc"

- name: OTEL_EXPORTER_OTLP_INSECURE
  value: "true"
These settings ensure that logs, metrics, and traces from your applications are sent to the OpenTelemetry agent over OTLP (gRPC).
Once applied, your application telemetry will appear in Coralogix Infrastructure Explorer alongside infrastructure data.
Next steps
Enable host monitoring for your cloud and on-prem machines by following Getting started with host monitoring.
Related resources
- Getting started with Kubernetes monitoring
- Host data enrichments
- Configure applications to send telemetry