Exploring your infrastructure
Use Infrastructure Explorer to view, search, and analyze your discovered infrastructure resources.
Infrastructure Explorer provides a unified view of your Kubernetes clusters, AWS EC2 instances, and Azure Virtual Machines, helping you understand what is running, where it is running, and how resources are related. It combines current-state visibility with historical exploration so teams can both operate their systems effectively and understand how their infrastructure evolves over time.
By default, Infrastructure Explorer opens in Live view, showing the currently active resources in your environment. Switch to Inventory view to explore resources over time and analyze infrastructure changes across a selected time range.
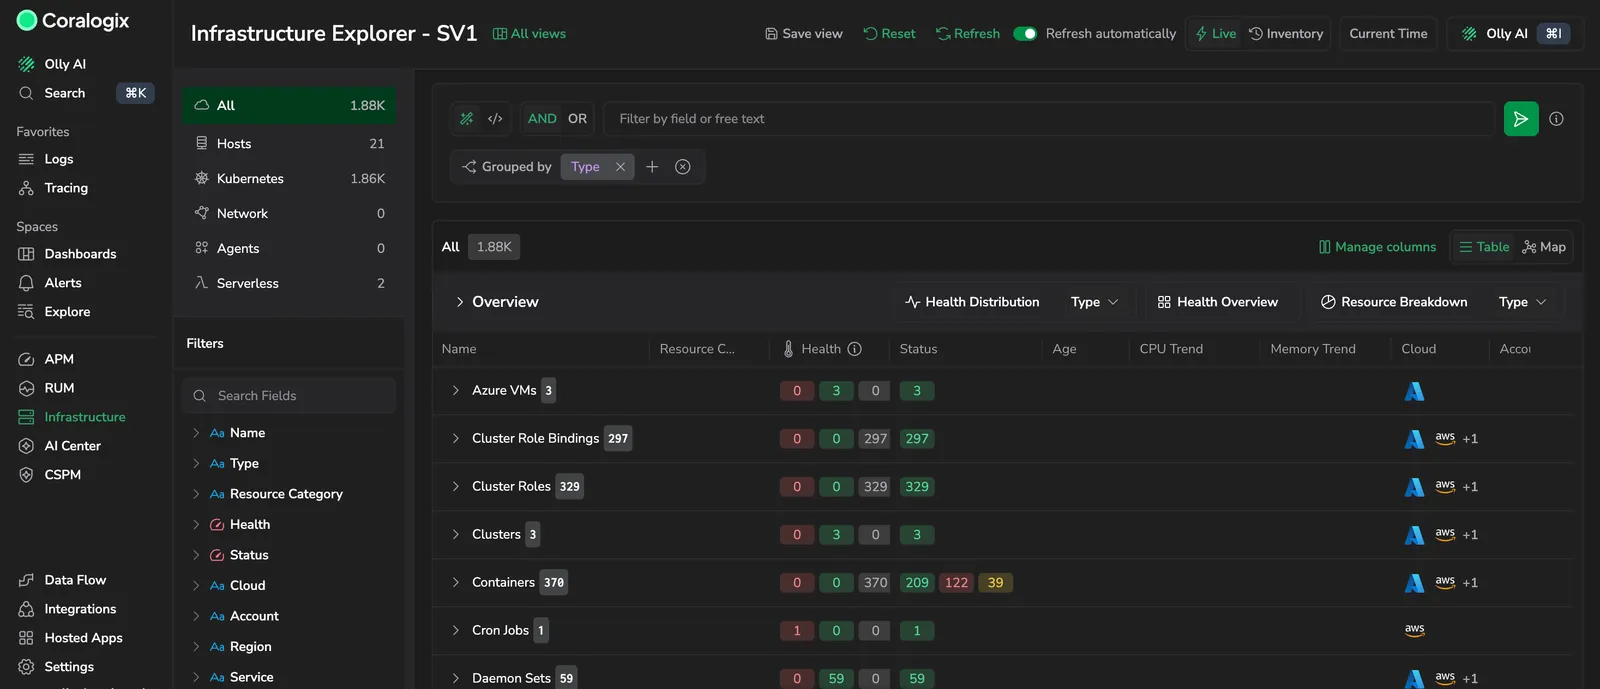
Shows the Filters sidebar on the left, the query bar with its Grouped by chips, and the resource table.
Use Infrastructure Explorer to:
- Search and filter infrastructure resources across your environment.
- Group resources by attributes such as type, account, cloud, or region.
- Monitor active systems in real time.
- Explore infrastructure history and changes over time.
- View detailed relationships, configurations, events, and operational data.
What you need
Access Infrastructure Explorer when all of the following are true:
- You have access to Infrastructure, then Infrastructure Explorer.
- You connected at least one Kubernetes or cloud integration with discovery enabled.
- You have the
INFRASTRUCTURE-EXPLORER:READpermission. See the centralized Permissions list for the system roles that include it.
Open Infrastructure Explorer
To open Infrastructure Explorer:
- Select Infrastructure, then Infrastructure Explorer.
- The page opens in Live view, showing active resources in your environment.
Explore the Infrastructure Explorer view
Infrastructure Explorer uses two modes that support different workflows: Live view and Inventory view. Use Live view to monitor and troubleshoot currently active resources. Use Inventory view to explore resources over a historical time range.
Understand the interface
The Filters sidebar on the left lets you narrow the table by attributes such as Name, Resource Category, Type, Health, Status, Cloud, Account, Region, Service, Environment, and Team. Filters support multi-select and persist across Live and Inventory views, so you keep context when switching modes. See Filter with the sidebar.
The search bar supports keyword search and Lucene queries. Search applies globally across both views, which keeps investigations consistent between operational and historical workflows.
Live view (default) shows currently active resources. Metrics shown in Live view are based on averages over the last 15 minutes. This view is designed for monitoring and troubleshooting currently active resources. Time-range exploration is disabled as it shows the active resources based on current time.
Inventory view shows resources based on their lifecycle events within a selected time range. It includes resources that no longer exist if they were active during that period. Use this view to explore infrastructure changes, review history, and analyze how environments evolve over time.
The time range picker is available only in Inventory view. It defines the time range for exploration. In Live view, the time range picker is disabled to clearly indicate a fixed current-state context.
Reset clears filters, grouping, and search state.
Refresh reloads discovery data and the current resource state. To have Coralogix do it for you, see Refresh the catalog automatically.
The table updates based on the active mode. Live view shows active resources. Inventory view shows time-scoped resources.
Select Table or Map in the top right of the results area to switch between the resource list and the topology map, a hexagon view of resource health. The Map view is available in Live view only.
Refresh the catalog automatically
Turn on Refresh automatically in the header to have the resource catalog reload on its own every five minutes, so a long investigation keeps current without you selecting Refresh. It applies to the table and the topology map, in both Live and Inventory views, and a short message confirms each reload.
Points worth knowing:
- It starts off every time you open Infrastructure Explorer.
- Anything that reloads the catalog restarts the five-minute wait, so an automatic reload never lands immediately after you change the time range, switch resource type, or refresh by hand.
- If the browser tab is in the background when a reload is due, it waits until you return to the page.
While the toggle is on, the New data may be available prompt no longer appears, because the catalog is already keeping itself current.
Filter with the sidebar
The Filters sidebar narrows the resource table without writing a query. Each filter lists the values present in your current results.
- Use Search Fields at the top of the sidebar to find a filter by name.
- Select a filter name to expand it and load its values.
- Select one or more values. The table updates with each selection.
- Select a value again to clear it.
Each filter carries a small icon for the kind of data it holds, the same convention Explore uses, so you can tell a text field from a numeric one at a glance. Status presents its values as colored chips that match the health colors in the table.
Filters narrow each other. Selecting a value in one filter reloads the other expanded filters so they offer only the values still present in the results. Select us-east-1 under Region, for example, and Cluster lists only the clusters in that region. The filter you are working in keeps its full set of values, so you can still select several. A collapsed filter loads its narrowed values when you expand it.
Typing in the search bar narrows every expanded filter the same way, so the values on offer always reflect what the search returned.
After each selection the other expanded filters show a brief loader, and their values can reorder or drop away as they narrow.
Your selections stay visible. When a filter holds more values than it shows at once, collapsing the list keeps the values you selected in view instead of cutting the list at a fixed point.
Expanded and collapsed filters stay as you left them when you move between resource type pages, as long as the same filter applies to the page you land on.
Filter on readiness
Pods and containers filter on readiness as a ratio, not a boolean. Yes means every container or pod is ready, for example 3/3. No means at least one is not, for example 2/3. A partially ready resource is therefore No, which is what you want when hunting for something half-up.
Manage columns
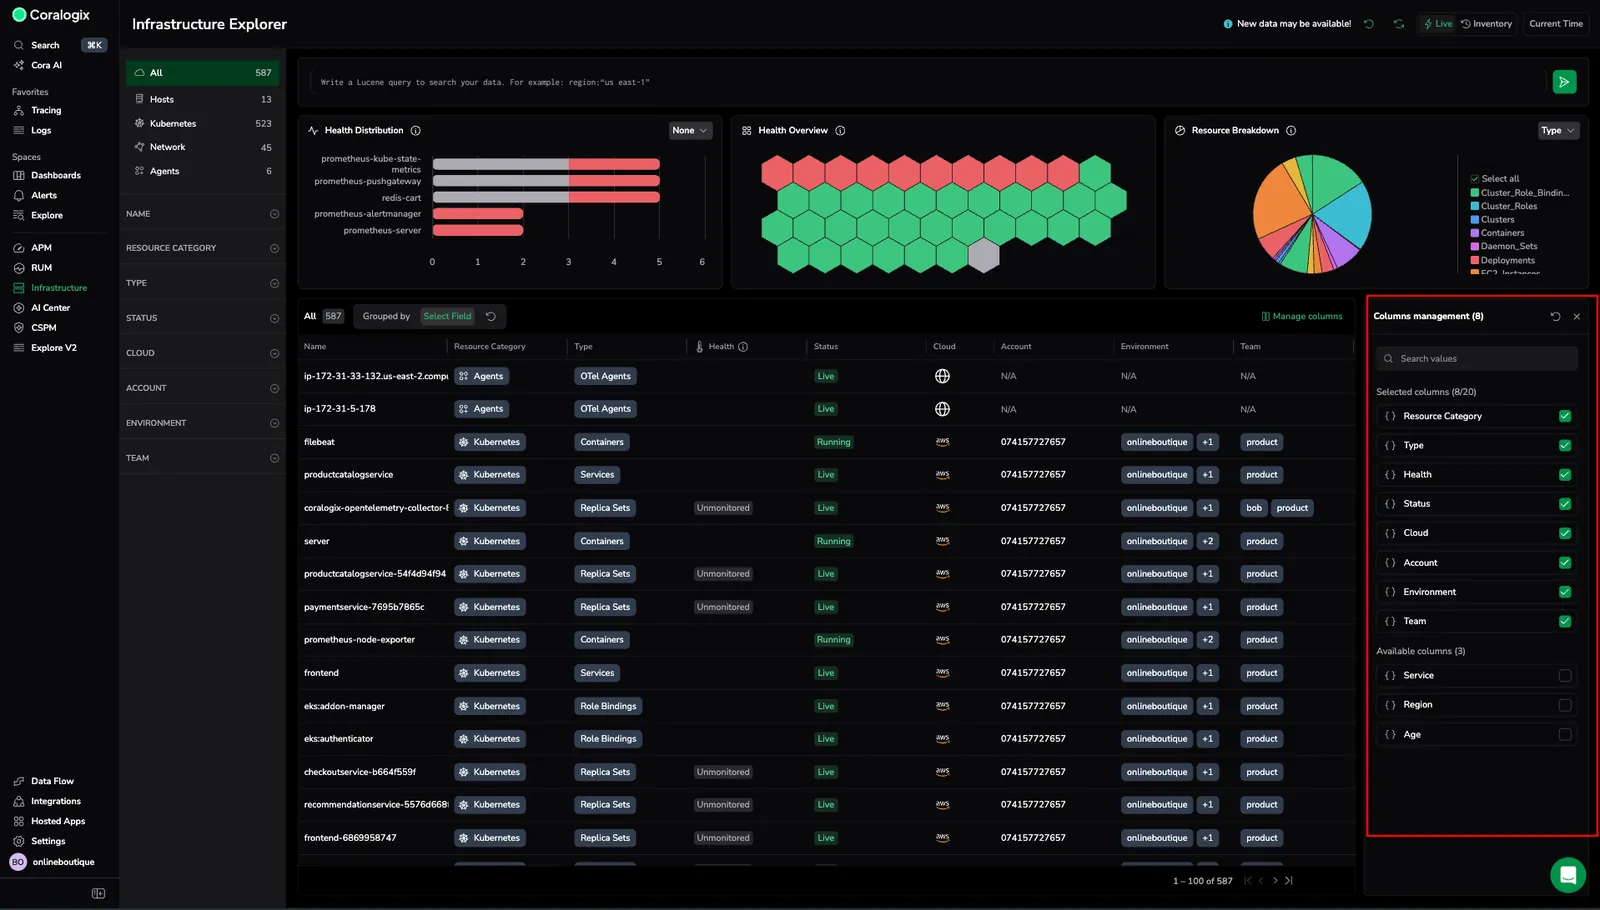
Select Manage columns to customize which columns appear in the table. A Columns management panel opens, showing all available columns with checkboxes to toggle visibility. Select up to 20 columns at a time.
Drag and drop columns in the panel to rearrange their order in the table. Use the search bar at the top of the panel to find specific columns by name.
Group resources
Use Group by to organize resources by shared attributes. Grouping applies to the whole catalog.
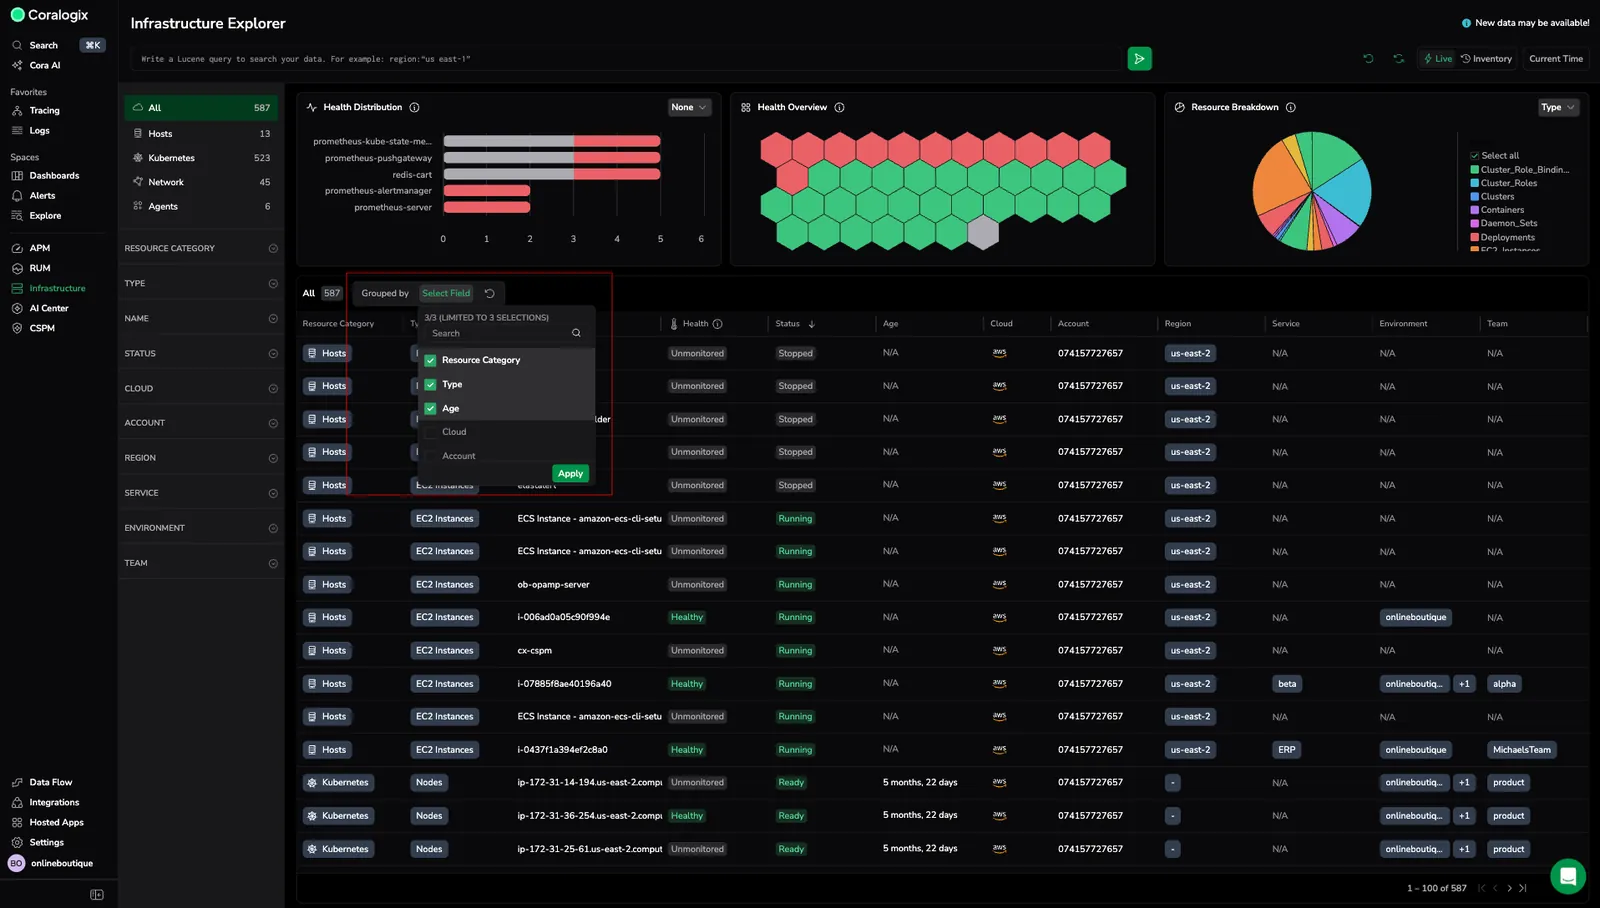
The Grouped by control sits in the search bar section, below the search field. Each grouping appears as a chip:
- Select the add control to open a searchable field picker and add a grouping, up to three. In the picker, a Default badge marks the fields the current resource type groups by out of the box.
- Drag a chip to change the order the groupings nest in.
- Select the remove control on a chip to drop that grouping, or Clear all to drop them all.
The fields on offer depend on the resource type, so the picker adapts to the resources in view: alongside common attributes such as resource category, type, cloud, account, and region, it includes ownership attributes such as service, environment, and team, and resource-specific properties such as operating system, network interface, or cloud identifier.
Each resource type opens with a default grouping. For example, hosts group by Region, pods by Namespace, deployments by Service, and all resources by Type. Grouping by Type, for example, shows ReplicaSets, ClusterRoles, and PersistentVolumes together so you can compare similar resources quickly.
A grouping you select follows you. Group Hosts by Region, switch to Pods, and Pods stays grouped by Region instead of falling back to its own default. Clearing the grouping counts the same way, so the next resource type also opens with no grouping.
A grouping you never selected does not follow you. If a page opened at its own default grouping, the resource type you move to opens at its own default too.
When the new resource type cannot use your grouping. Two cases behave differently:
- If one of your groupings is the identifier column of the type you move to, that grouping is dropped and the rest are kept, because grouping by the identifier would push it out of view.
- If any other grouping does not exist on the type you move to, the whole grouping resets to that type's default.
Clearing the search or resetting filters also returns the grouping to the resource type's default.
The overview widgets above the table group by one level only. When you group the table by more than one field, the widgets follow the first grouping.
View resource details
To see more information about a specific resource:
- In the Infrastructure Explorer table, select any resource.
- A details panel opens, displaying tabs with live and contextual data.
Each tab provides a focused view of the resource:
| Section | Description |
|---|---|
| Overview | Displays live status and key metrics such as deployments, pods, and memory usage. |
| Details | Shows metadata, labels, and deployment information. |
| Ownership | Shows who is responsible for a resource by resolving its environment, service, and team into a single, consolidated view. |
| Health | Lists the health policies applied to the resource, whether each policy is healthy or critical, and the evidence behind each result. |
| Relationships | Lists connected resources like Pods, Containers, or Namespaces. |
| Logs | Displays runtime logs for troubleshooting. |
| Metrics | Shows performance metrics including CPU and memory usage. |
| Events | Displays lifecycle and system events. |
| Configuration | Displays the YAML or JSON configuration currently applied to the resource, enabling version comparison and change analysis. |
The Configuration tab also carries a change grid covering the last 14 days. Depending on what the resource reports, it shows health changes, configuration changes, or both, so you can line a config change up against the moment health moved.
The time context depends on which view you're in:
- In Live view, details shows data from the last 15 minutes.
- In Inventory view, details shows data based on your selected time range.
When a resource is opened from somewhere else in Coralogix, such as a Case or an APM service, the panel may say why it has nothing to show instead of rendering empty:
| Message | What it means |
|---|---|
| No recent signal from this resource | No recent metrics or events arrived. The resource may no longer be running. |
| Resource not monitored in Infrastructure Explorer | The resource exists but falls outside your Infrastructure Monitoring configuration. Include it to get health, metadata, and related data. |
| See full picture of this resource | Infrastructure Monitoring is not enabled. The panel offers Set up Infrastructure Monitoring. |
How it works
Infrastructure Explorer pulls data from your Kubernetes and cloud integrations.
Each resource is indexed with metadata such as type, name, cloud, account, and region. Discovery and lifecycle events keep data updated continuously. Filtering, grouping, and search update dynamically based on the active view and selected time context.
Complete a source integration
Infrastructure Explorer relies on your connected integrations to discover resources. If a source is not fully integrated, the Explorer shows a banner for that source, based on your cloud footprint and the integrations you already have, prompting you to finish the setup so its resources and metadata appear in the catalog.
Select the banner's button (Get Started or Get Integration) to open that source's integration setup, for example the AWS or Azure resource catalog integration. Once the integration is complete, the source's resources populate Infrastructure Explorer.
Limitations
Be aware of the following constraints:
- Grouping supports up to 3 fields.
- Some resources do not show metrics or logs if telemetry is not configured.
- Data refresh depends on discovery and sync frequency.
Next steps
Filter infrastructure resources using Builder mode or Lucene queries by following Search and filter resources with Lucene builder.