Config Navigator
Monitor and manage pipeline configurations
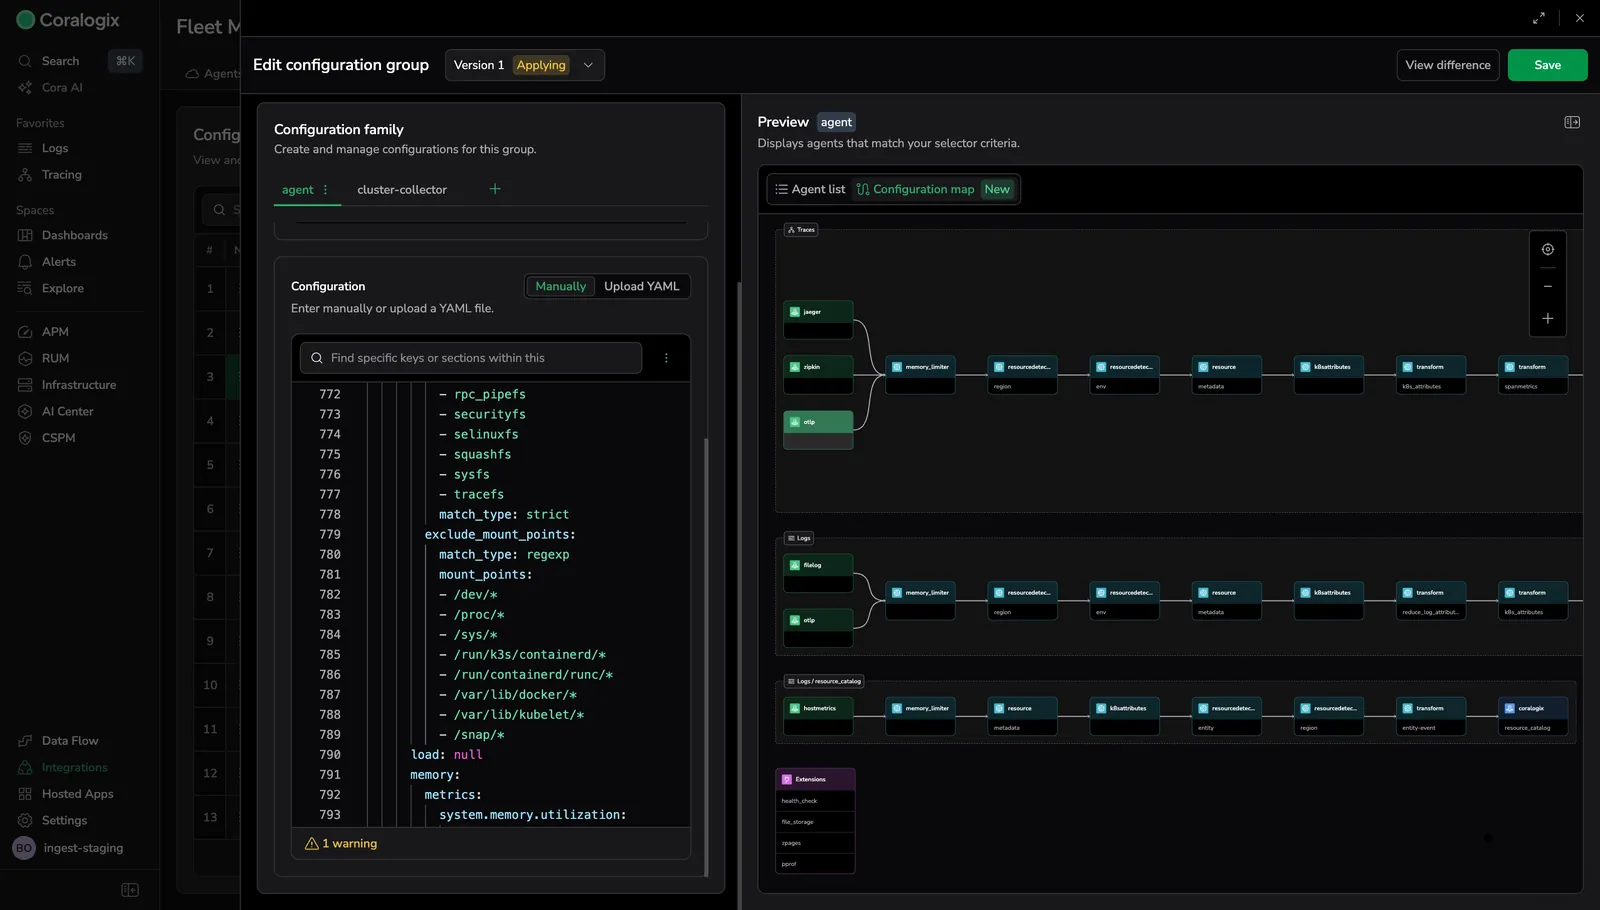
Config Navigator provides a real-time, interactive visualization of your OpenTelemetry (OTel) Collector configurations. This feature transforms complex YAML definitions into a transparent architectural map, allowing you to validate data flow, verify processing logic, and understand the precise relationship between pipeline components.
Config Navigator also continuously validates your configuration structure, component usage, and YAML syntax — surfacing errors and warnings directly in the graph and editor before changes reach production environments.
Key benefits
- Visual debugging: Identify filters, samplers, and other components that affect data flow.
- Built-in validation: Detect structural errors, undefined components, and unused configuration before deployment.
- Architectural transparency: View the full collector architecture, including all active receivers, processors, and exporters.
- Logic and sequence validation: Confirm processor execution order using a clear left-to-right flow.
- End-to-end traceability: See how data routes from receivers to exporters across pipelines.
- Live feedback: The visualization updates automatically as the YAML configuration changes.
Operational comparison
The table below highlights the difference between manually inspecting YAML and logs versus using Config Navigator's visual, graph-based view to understand, validate, and debug configuration behavior more efficiently.
| Goal | Manual approach | Config Navigator |
|---|---|---|
| Verify logic | Inspect YAML lists | View ordered processor flow |
| Debug data flow | Review logs and CLI output | Trace paths visually |
| Understand configuration behavior | Read configuration files | Inspect active components in the graph |
| Validate routing | Follow pipeline mappings | Highlight receiver-to-exporter paths |
| Detect structural issues | Discover at runtime | Real-time schema validation in UI |
| Catch configuration drift | Manual cleanup | Unused component warnings |
Pipeline graph visualization
Config Navigator renders your OTel Collector configuration as an interactive directed graph. Each pipeline component appears as a node, and edges represent the data flow between them. The graph reads from left to right, following the standard OTel pipeline lifecycle: receivers ingest telemetry, processors transform it, and exporters deliver it to destinations.
The graph updates in real time as you edit the YAML configuration. Selecting any node highlights its full data path from ingestion to export, making it easier to trace how telemetry flows through complex, multi-pipeline configurations.
Connector routing
Connectors act as bridges between separate pipelines, enabling multi-stage routing scenarios. In the graph, connectors appear as distinct nodes linking the exporter side of one pipeline to the receiver side of another. This visualization clarifies how telemetry data is handed off between pipelines — for example, routing span-derived metrics from a traces pipeline into a metrics pipeline for further processing.
When a connector links two pipelines, Config Navigator renders the full cross-pipeline path. Select a connector node to highlight both the upstream pipeline (feeding data into the connector) and the downstream pipeline (receiving data from the connector).
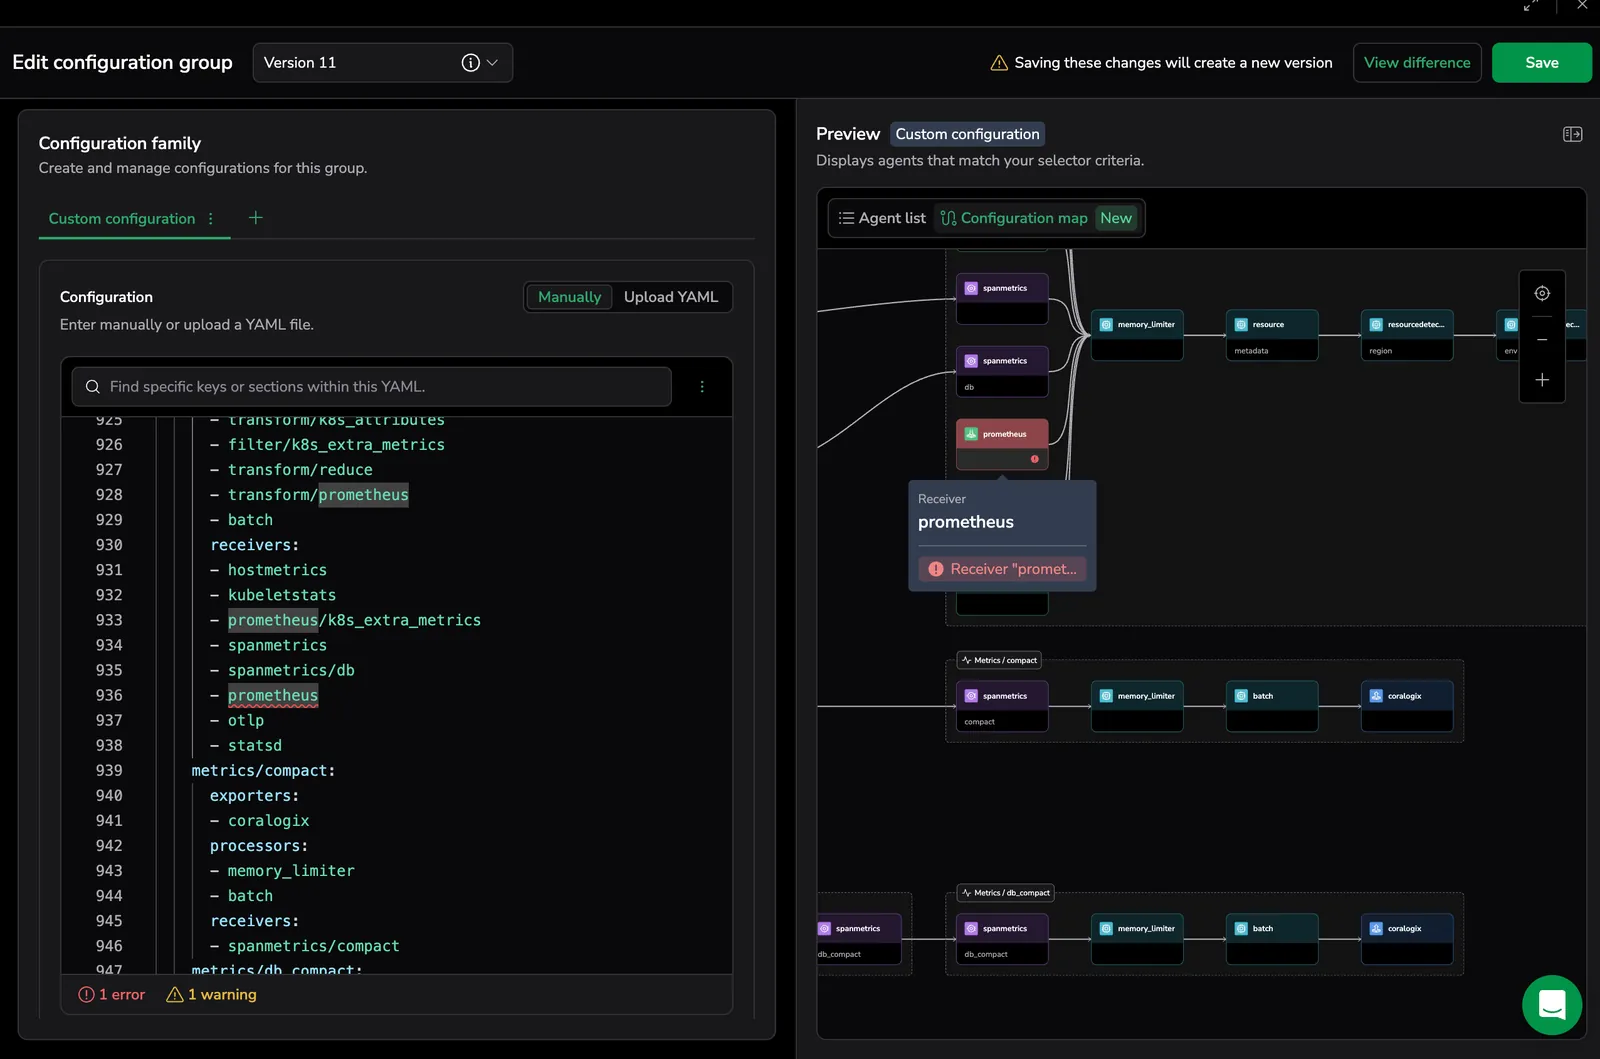
Error and warning indicators
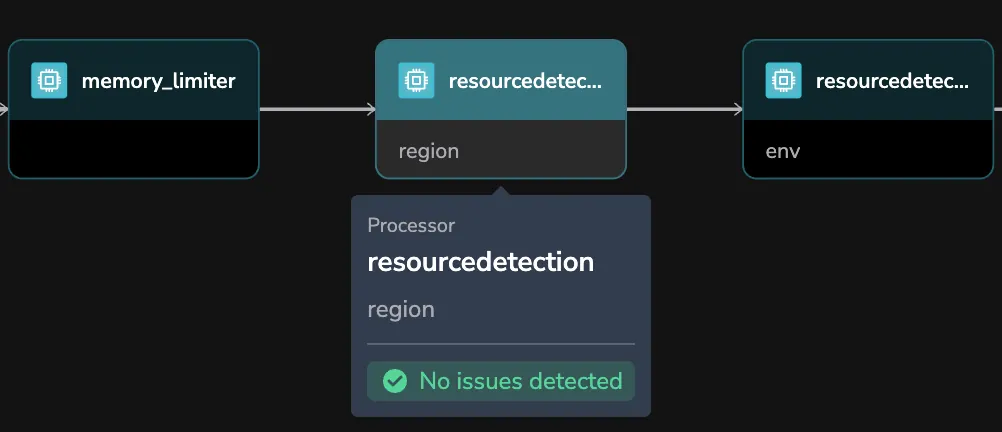
Config Navigator overlays validation results directly on the graph. Nodes with errors display a red outline, and nodes with warnings display a yellow outline. Hover over an indicator to view the specific issue. For more detail on validation categories, see Validation and error feedback.
Component mapping and visualization
Config Navigator renders standard OpenTelemetry components as distinct nodes, forming a complete ingestion-to-export map.
| Component | Description | Operational value |
|---|---|---|
| Receivers | Data ingestion points (e.g., OTLP, Host Metrics). | Immediate visibility into active data sources. |
| Processors | Transformation, filtering, and enrichment logic. | Clear, linear ordering that exposes execution logic. |
| Exporters | Destinations for telemetry data. | Confirmation of correct routing to backends. |
| Connectors | Bridges between pipelines, enabling multi-stage routing. | Cross-pipeline traceability and simplified routing visualization. |
| Extensions | Operational and control-plane components. | Centralized view of health and auth settings. |
Validation and error feedback
Config Navigator validates your configuration in real time and highlights issues directly in the map and YAML editor.
- 🔴 Errors (red) – Must be fixed. These prevent a valid or deployable configuration.
- 🟡 Warnings (yellow) – Valid configuration, but likely unintended or redundant.
Structure validation (schema errors) 🔴
These errors occur when the configuration does not follow required OpenTelemetry Collector structure.
Common examples:
- Missing required sections (
receivers,exporters,service) service.pipelinesmissing or not a map- A pipeline defined as an array instead of a map
receivers,processors, orexportersnot defined as arrays- Empty receivers or exporters
extensionsdefined incorrectly
Impact: The Collector would fail to start with this configuration. Shown: On the relevant pipeline/component node and in the YAML editor.
Component consistency validation
Undefined component 🔴
A component is referenced in a pipeline but not defined at the top level.
Example: A processor listed in a pipeline but missing under processors:.
Impact: Collector startup failure. Shown: On the relevant node and in the editor.
Unused component 🟡
A component is defined but never referenced in any pipeline.
Impact: Safe to deploy, but may indicate configuration drift or leftover config. Shown: On the unused component node and in the editor.
YAML syntax errors 🔴
If the YAML cannot be parsed (e.g., indentation errors or missing colons), the pipeline graph cannot be rendered.
Shown: In the YAML editor (line/column markers and footer). Note: Syntax errors do not appear on the map because the configuration cannot be interpreted.
Why this matters
When configurations are applied through Fleet Management, the Collector process may be restarted by the Supervisor to apply the new configuration. Catching structural and logical errors in Config Navigator reduces the risk of rollout failures and temporary telemetry interruption.
Navigating the pipeline canvas
Use the canvas controls to explore your configuration:
- Zoom and pan: Navigate large or dense pipeline graphs.
- Fit to view: Scale the entire pipeline to your screen.
- Node selection: Select a component to highlight its data path from ingestion to export.
Common use cases
Validate processor order
Ensure processors are applied efficiently and correctly.
- Scenario: High-volume data should be filtered before batching or sampling.
- Solution: Review the processor chain visually and adjust YAML ordering if needed. The graph refreshes instantly.
Diagnose missing data
Quickly identify where data may be dropped.
- Scenario: Logs are ingested but do not appear in Coralogix.
- Solution: Trace the path between receiver and exporter and inspect filter or sampler nodes acting as checkpoints.
- Additional safeguard: If data flow issues are caused by misconfiguration (for example, an undefined exporter or structural error), Config Navigator surfaces the exact error location directly on the graph.
Verify multi-destination routing
Confirm correct routing in complex environments.
- Scenario: Different data streams must reach different exporters.
- Solution: Select a receiver to highlight all connected exporters and verify mappings visually.
Trace cross-pipeline data flow
Follow telemetry across pipelines connected by connectors.
- Scenario: Span metrics derived from a traces pipeline must feed into a metrics pipeline for aggregation and export.
- Solution: Select the connector node bridging the two pipelines. Config Navigator highlights the full path from the upstream receiver through the connector and into the downstream exporter, confirming the handoff is configured correctly.
Related links
- Learn more about getting started with Config Navigator in the Quick start: Your first time using Config Navigator guide.
- To edit the pipeline interactively rather than read it, see the Visual builder.
- OpenTelemetry concepts: To learn more about how components work, see the OpenTelemetry Collector documentation.
- YAML reference: For details on supported configuration schema, refer to the Collector Configuration guide.
Next steps
Get started with your first configuration visualization in Quick start: your first time using Config Navigator.