Concepts
Tracing helps you understand how requests move through your system and why they behave the way they do. It is the starting point for investigating latency, errors, and unexpected behavior across distributed services.
This page introduces the core concepts behind tracing and explains why traces and spans matter.
Why tracing matters
Modern systems are distributed. A single user action such as loading a page, submitting a form, completing a checkout, can trigger work across many services, databases, queues, and third‑party APIs. When something goes wrong, metrics can tell you that there is a problem, and logs can show individual events, but neither explains how the full request behaved end to end.
Distributed tracing closes this gap by showing:
- What happened across services
- The order in which operations occurred
- How long each step took
- Where errors, bottlenecks, or unexpected behavior were introduced
Explore spans turns tracing data into an investigation workflow across three tabs:
- Spans (default) answers which operation explains a behavior.
- Traces answers which end-to-end request best represents the problem.
- Flows shows how services communicate across the request.
Starting from a symptom—a latency spike, an error rate increase, or unexpected behavior—narrow the scope on the tab that matches the question, filter, and drill into a representative span or trace, moving from symptom to root cause without leaving the page.
Core concepts
What is a trace?
A trace represents the complete lifecycle of a single request or transaction as it travels through your system.
A trace answers questions such as:
- Why was this request slow?
- Why did this request fail?
- Which services were involved in handling it?
Each trace captures the full story of one execution path, from the first incoming request to the final response.
What is a span?
A span represents a single operation within a trace.
Examples of spans include:
- An incoming HTTP request
- A call to another service
- A database query
- A cache lookup
Each span contains timing information and contextual data, such as service name, operation, attributes, tags, and error details.
What is a root span?
Root span (entry span) is the first span in the trace and represents the end-to-end request (for example, an incoming HTTP request). All other spans are downstream work triggered by it, directly or indirectly. When troubleshoot latency, the root span duration is usually the “total time,” while child spans explain where that time was spent. Root span is often the top-most parent. In distributed systems there may be multiple “entry” spans per service, but the trace still has a single root in most instrumentation.
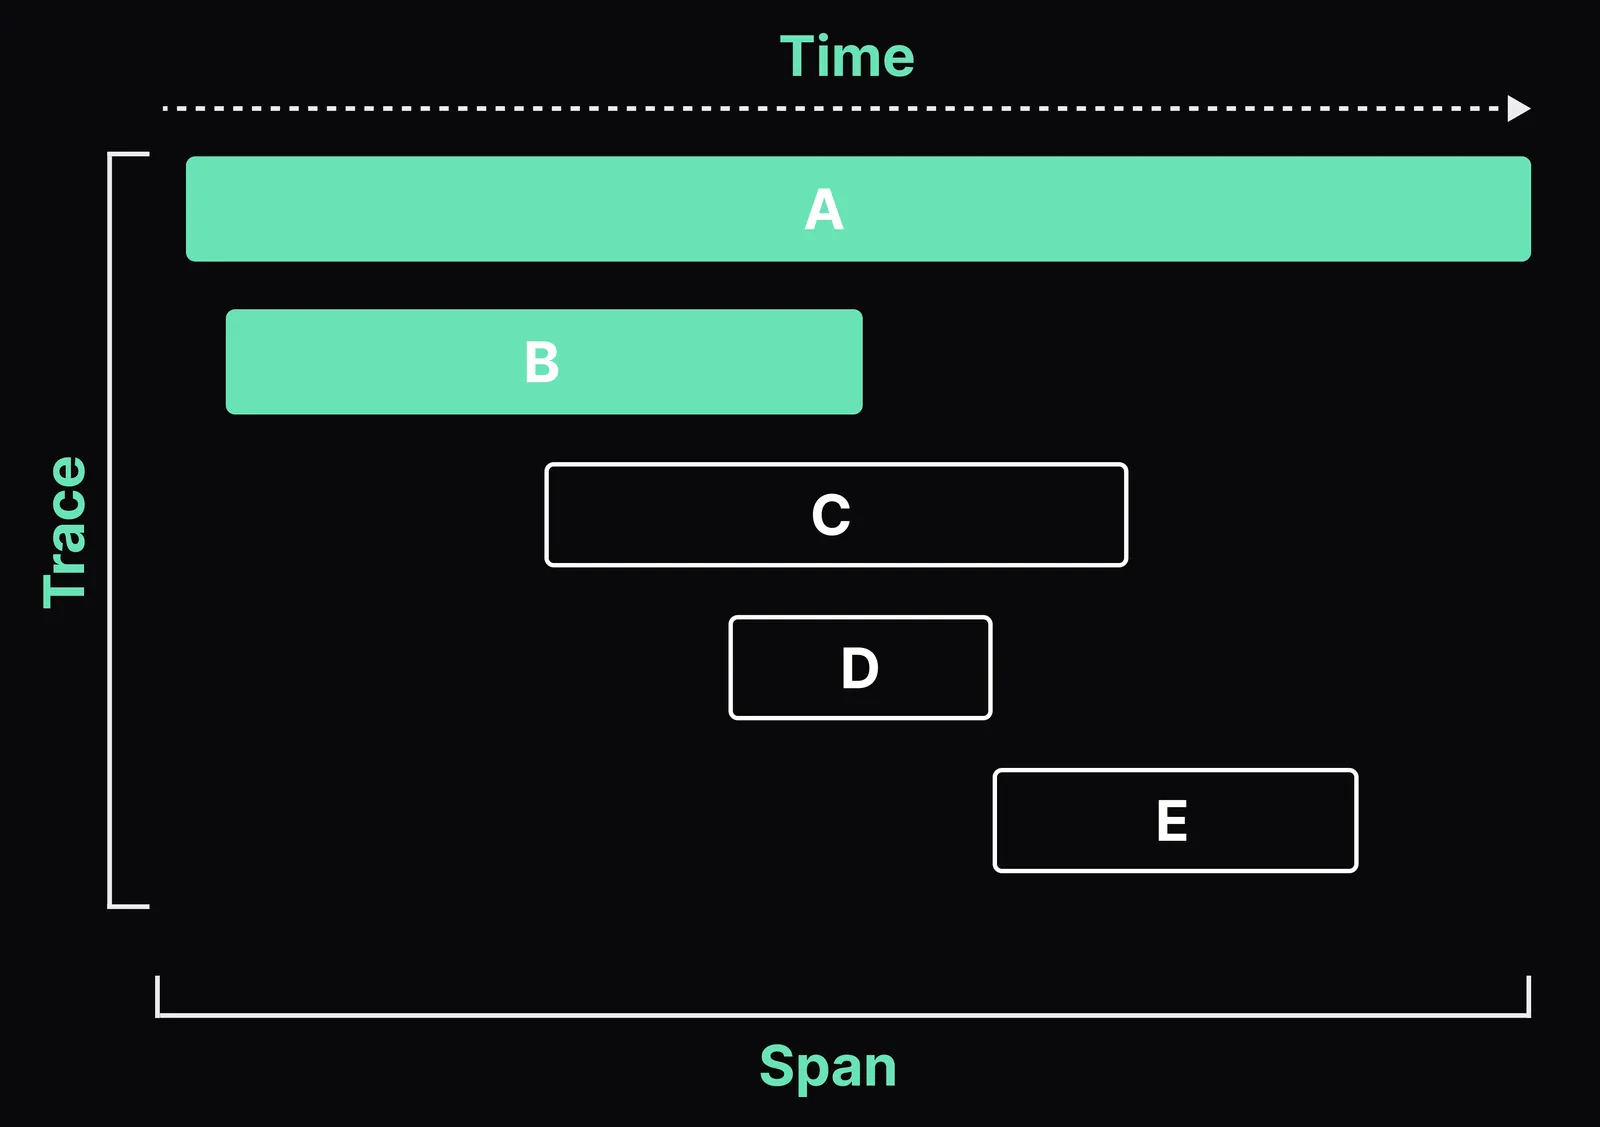
How spans relate within a trace
Spans are connected using parent‑child relationships that reflect how work flows through your system:
- A parent span represents a higher‑level operation.
- Child spans represent downstream work triggered by that operation.
Together, these relationships form a structured view of execution order, parallelism, and dependencies. Understanding this structure is essential for identifying where latency accumulates or where failures originate.
Span kinds
Every span has a kind that describes the role it plays in a distributed request. Explore spans uses span kind to classify spans, determine how filters are applied, and decide which drilldown views are most relevant. Filter by SERVER to focus on inbound requests, or by CLIENT to investigate outbound calls to dependencies.
| Span kind | Label in Explore | Meaning |
|---|---|---|
SERVER | Incoming | Handles an inbound request into this service. |
CLIENT | Outgoing | Makes an outbound request to another service. |
PRODUCER | Async out | Publishes a message to a queue, broker, or topic. |
CONSUMER | Async in | Receives and processes a message from a queue or broker. |
INTERNAL | Internal | Performs work inside the service, such as business logic or data transformation. |
The Spans tab shows the kind as a directional arrow next to each row—inbound, outbound, async publish, async consume, or internal. Filter by kind with the Span kind filter in the side bar.
Span volume over time
Explore spans shows a Count Spans over time chart above the results table, with each bar representing the number of spans in a time bucket for the active query. Pair this volume signal with the Errors toggle and the Duration filter in the query builder for spans to focus on failing or slow operations.
Next steps
Query traces and spans, filter results, and save views in Get started with Explore spans.