Span related data
Overview
When you investigate a slow request or a failing operation, a span on its own rarely tells the full story. Span Related Data brings the most relevant signals (logs, events, profiling, infrastructure context, and AI session) into the same drilldown so you can move from "something is wrong" to "here’s why" without jumping between tools.
Availability of tabs depends on the selected level (span/trace/service) and enabled data related.
Related data is designed for fast troubleshooting:
- Confirm what failed (Logs / Errors).
- Understand what changed (Events).
- Understand where time was spent in code (Profiling).
- Infrastructure tells you whether the environment contributed.
- Troubleshoot AI behavior when the span represents a GenAI/LLM operation (AI Session).
Open related data
- Go to Explore spans.
- Select a trace or a span.
- Navigate to the bottom on the page to view Related data.
- Use the tabs on the left to switch between Logs, Events, Profiling, Infrastructure, and AI Session (when available).

If you need more space, you can maximize the drilldown and minimize it again when you’re done.
Logs
Use this tab to quickly answer: "What failed, and what happened right before it?" without leaving the trace investigation flow.
How correlation works
Logs are correlated to spans based on field mappings you configure (or that are detected automatically). The correlation uses three dimensions:
- Logs field: the log field used to match against spans (for example, a trace ID or span ID extracted into a log field)
- Span field: the span attribute used for matching. For the Span, Trace, and Service (Trace-linked) By options, Coralogix matches both OTel variants automatically.
span_idtogether withspanIdfor Span, andtrace_idtogether withtraceIdfor Trace - Service field: the service-level attribute used to scope logs to the correct service
If your data is instrumented with OpenTelemetry (OTel) and context propagation is set up correctly, correlation typically works automatically when standard OTel fields are present. Coralogix maps common OTel fields internally so the UI can show your original field names while correlation still works behind the scenes.
If a tab is empty, it usually means one of the correlation inputs (trace or span IDs or service context) is missing or not being extracted.
What you can do here
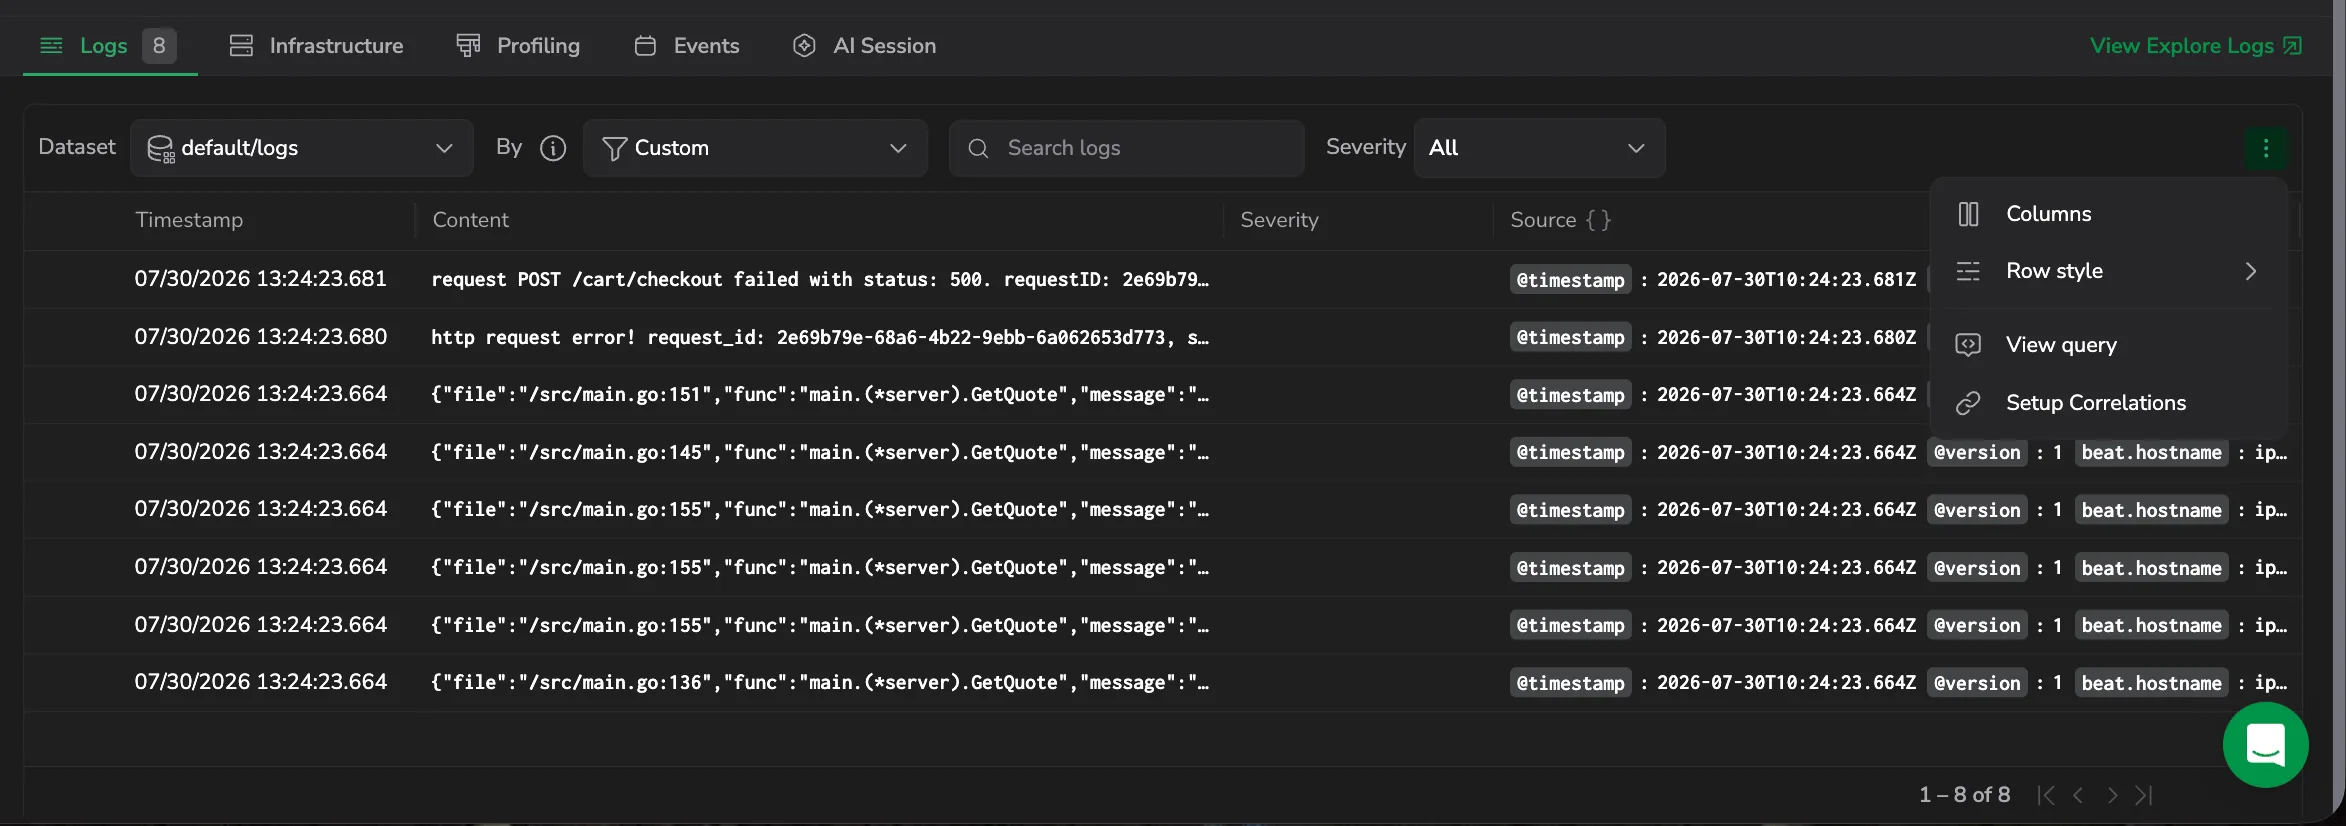
- Use the By selector to control how logs are correlated:
- Custom: correlates logs using the custom field mapping you configured in the correlation setup (logs field matched to span field)
- Span: correlates logs using the OTel semantic span identifier, matching both
span_idandspanId - Trace: correlates logs using the OTel semantic trace identifier, matching both
trace_idandtraceId - Service (Trace-linked): correlates logs using the service field from your correlation setup or
subsystem
- Use the Dataset selector, next to By, to control which logs datasets the correlation query runs against. All your logs datasets are selected by default, so the correlation spans everything at once and Coralogix runs a single query over them. To narrow it, select one or more specific datasets instead. Search the list to find a dataset by name. The selector shows the logs datasets you have permission to see, and it doesn't apply to the Custom view. Your choice is saved for next time and travels in the drilldown URL, so it survives a reload or a shared link.
- Filter by log severity: Debug, Verbose, Info, Warning, Error, Critical.
- Search within the correlated log results.
- Select a log row, or press Enter on a highlighted row, to open the Log details panel with the full log. Use the panel's previous/next controls to step through filtered logs without leaving the drilldown.
- Select View Explore Logs to continue investigation in the full logs experience.
- Use the menu to:
- Columns: choose which fields appear in the logs table.
- Row style: set how each log row is displayed.
- View query: open the Query Information panel with the correlation query.
- Setup Correlations: configure the correlation field mappings.
By correlation logic
Each By option uses a specific correlation:
| By | Correlation logic |
|---|---|
| Custom | Logs field matched to span field (from your dropdown configuration) |
| Span | span_id.keyword:"<spanID>" OR spanId.keyword:"<spanID>": both variants are queried in parallel |
| Trace | trace_id.keyword:"<traceID>" OR traceId.keyword:"<traceID>": both variants are queried in parallel |
| Service (Trace-linked) | coralogix.metadata.subsystemName (or custom service dropdown) matched to service name from span, scoped by trace_id / traceId matched to the trace ID |
Configure the content column
Select the cog icon next to the Content column header to customize which fields appear in the Content column. The slide-in dialog uses the same prioritized field selector as Configure prioritized keys in the logs table. Reorder, add, or remove fields, then apply, the Content column updates immediately. Your selection persists per drilldown query, so switching traces preserves the layout.
Suggested investigation path
- Start with Errors with Critical severity in Span view to see the most relevant failures.
- Move to Trace view if you suspect the error is downstream or part of a chain.
- Switch to Service (Trace-linked) view to understand whether the issue is systemic during the same timeframe.
- Use Custom view when your correlation uses non-standard field mappings.
View the query used for correlation
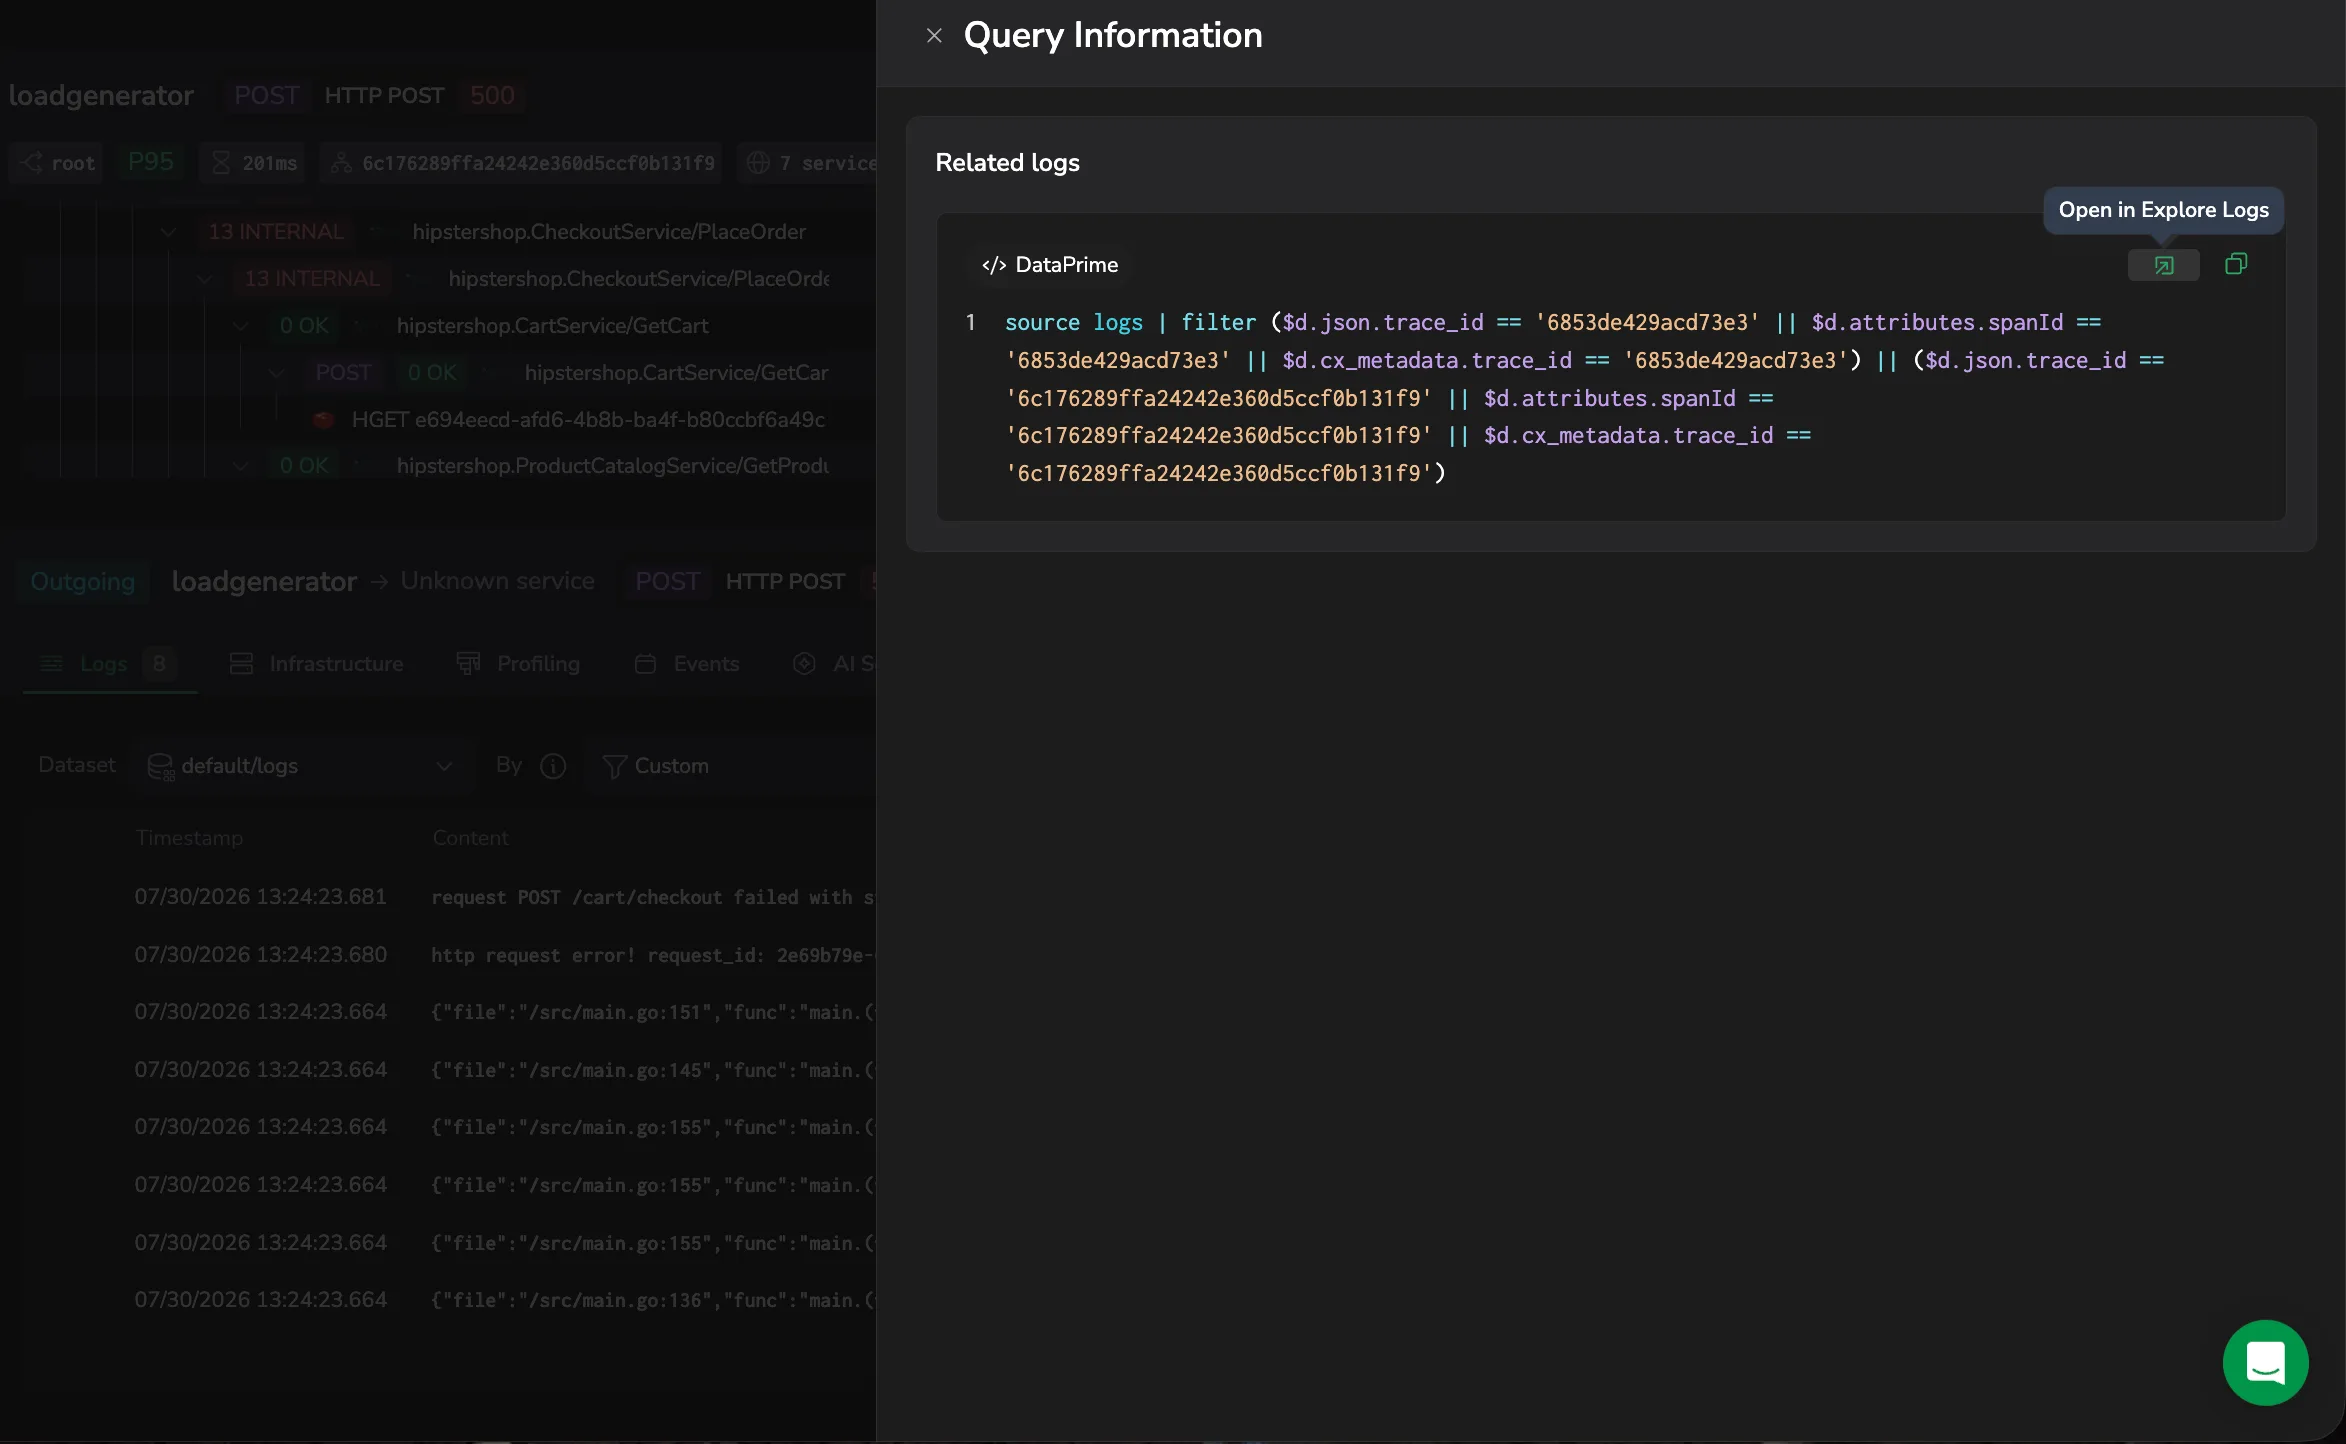
To see exactly how the logs are being pulled in, open the menu and select View query. The Query Information panel opens with the Related logs correlation query shown in DataPrime. If the current view has no correlation query, the panel notes that instead.
From the panel, you can:
- Copy the query to the clipboard.
- Select Open in Explore Logs to open the query in a new Explore tab and run it. The selected time range carries over.
Set up log correlation
In most cases, you don’t need to configure anything when using OTel. Logs include the standard identifiers and Coralogix maps them automatically. If you don’t see the logs you expect, configure correlation from the Logs tab.
When to configure correlation
- You see no logs in Span or Trace view, even though you know logs exist.
- Your logs don’t include OTel-standard fields (or the values appear in a different field name).
- You’re not using OpenTelemetry and need to correlate using your own log fields.
- You want to use Custom view with your own field mapping.
Option 1: OTel (recommended)
For the Span, Trace, and Service (Trace-linked) By options, Coralogix automatically maps log fields to spans. With OpenTelemetry instrumentation, standard fields like span_id, spanId, trace_id, traceId, and Subsystem are injected into log records and mapped for you, no manual configuration required.
For best results, logs should include at least one of the following:
trace_id/traceId/trace.idspan_id/spanId/span.id- Service context, such as
Subsystem(or an equivalent service identifier)
With these present, Coralogix can correlate logs to spans and traces automatically.
Option 2: Configure the correlation fields
- In the Logs tab, open the menu.
- Select Setup Correlations.
- Configure the three dropdown selectors:
- Logs: select the log tag or field used for correlation (for example, a custom
request_idortrace_idfield) - Span: select the span attribute used for correlation. Defaults to
spanIDandtraceID. - Service: select the service-level attribute used for correlation
- Logs: select the log tag or field used for correlation (for example, a custom
- Save your selection.
After configuration, the Custom view in the By selector uses your logs-to-span field mapping. The Span, Trace, and Service (Trace-linked) views continue to use their standard correlation logic.
Option 3: Create a parsing rule (when IDs exist but aren’t extracted)
If your trace/span IDs are present in the raw log message but not extracted into fields, correlation can’t work reliably until they’re parsed.
Create a parsing rule that extracts trace_id, span_id, and service context into structured fields. After the fields are extracted, Related data can correlate logs automatically.
Set a team default correlation view
By default, each user's By choice is remembered only in their own browser, so a new team member starts on the built-in default and can see empty Related Logs until they switch correlation manually. A team admin can set a default correlation view that applies to everyone on the team.
Set it from Settings, then Account, then Preferences, in the Team level view card. On the Explore row, use the Trace drill-down control to pick the correlation the whole team starts with: Span, Custom, Trace, or Service (Trace-linked).
Team members inherit this default with no manual setup. Any user can still change By in the Logs tab, which overrides the team default for that user and is remembered in their own browser.
Infrastructure
Use this tab to connect a span to where it ran and validate whether resource pressure contributed to the issue.
How correlation works
Unlike Logs, which correlate at query time by matching IDs, the Infrastructure tab correlates on the resource attributes carried on the span itself. Coralogix reads the OpenTelemetry resource attributes that describe where the span ran, builds a resource identity from them, and looks for an infrastructure resource (pod, node, or host) whose metrics were ingested under that same identity. When it finds one, it pulls that resource's metrics for the window around the span, so you can line up the span with the resource pressure at the moment it ran.
Correlation is therefore a two-sided match: the same identifying attributes must be present on both the span and the infrastructure metrics. If the span identifies a pod but no metrics were ingested under that pod's identity (or they were ingested under a different one) there is nothing to line up. This is why correlation works out of the box when spans and metrics both come from the Coralogix Helm chart, which labels both sides consistently, and why a custom collector or config map that labels only one side, or labels the two differently, yields spans that look fine but don't correlate.
Attributes Coralogix reads from the span
- Kubernetes (
k8s.*): pod, namespace, node, cluster, deployment, StatefulSet, DaemonSet, job, cronjob, and container names - Host (
host.*): host ID and host name - Cloud (
cloud.*): provider, platform, region, account ID, and availability zone - AWS ECS (
aws.ecs.*): task ARN, cluster ARN, launch type, and task family, when present
Both OTel dot notation and the underscore form Coralogix stores are matched, so k8s.pod.name and k8s_pod_name are equivalent. You don't need to normalize your span attributes.
For Kubernetes, the cluster is the first component of a resource's identity. A span therefore needs the cluster (k8s.cluster.name) alongside the pod, node, or namespace that identifies the resource, and the infrastructure metrics for that resource must carry the same cluster name. A cluster name that differs between the trace pipeline and the metrics pipeline is a common reason correlation silently fails.
What correlation requires
- The span carries resource attributes that identify where it ran, for Kubernetes, the cluster plus a pod, node, or namespace; for a host,
host.idorhost.name. - Infrastructure monitoring is ingesting metrics for that same resource, under the same identifying attributes.
- The resource reported metrics within a 15-minute window centered on the span's start time (roughly 7.5 minutes before and after). The shared time anchor that ties the span to the metrics around it.
When at least one recognized attribute resolves to a resource with metrics, Coralogix displays that resource's metrics (Pods appear first when available). If nothing resolves, the tab is empty. See Infrastructure is missing to troubleshoot.
What you can do here
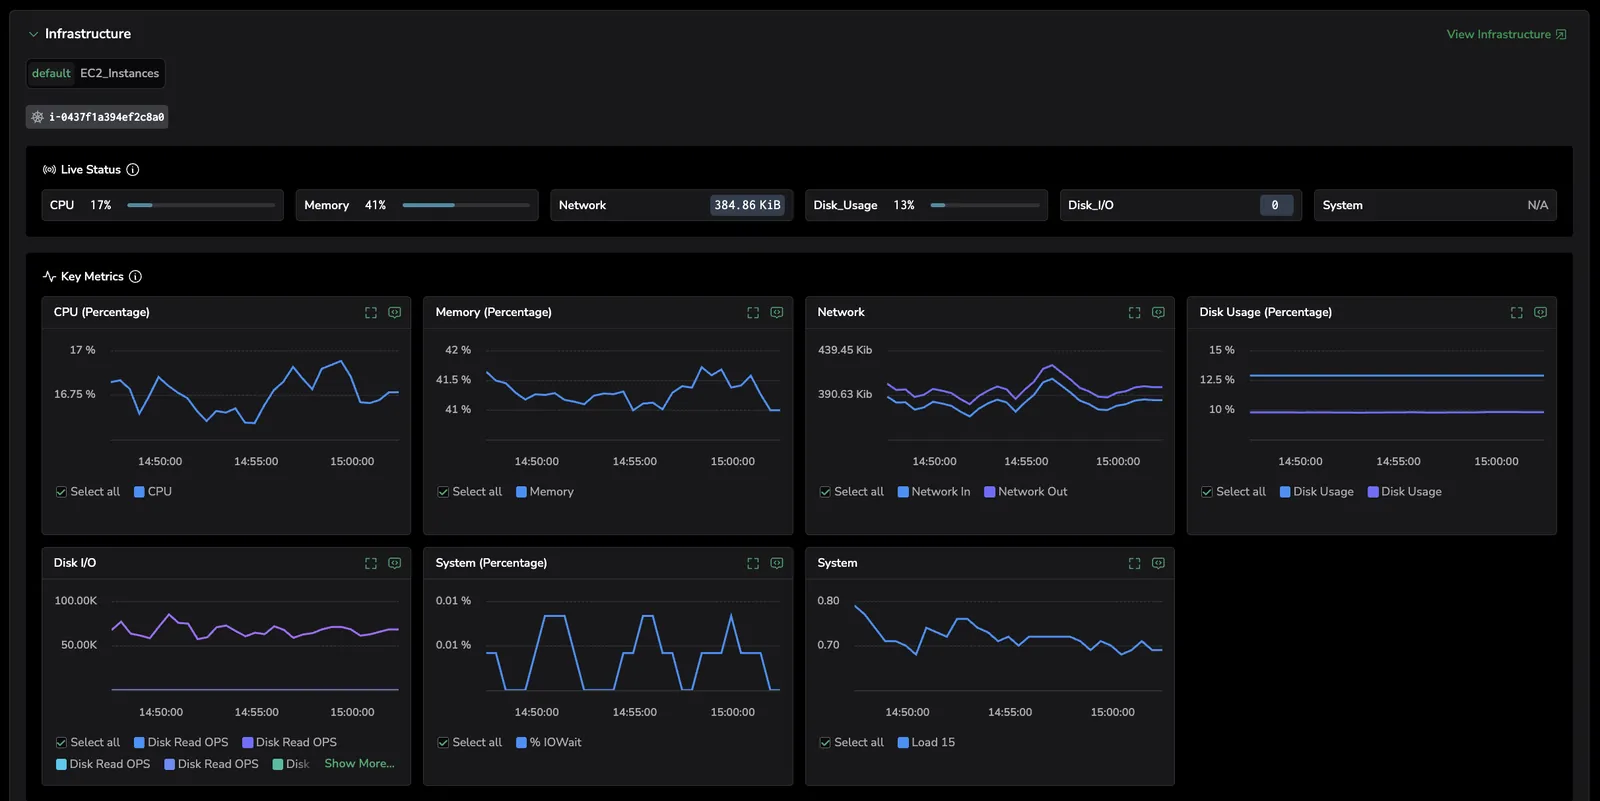
- Review the infrastructure context for the span, including host/process/pod/container identifiers and Kubernetes context (namespace, node, cluster).
- Read the live status of pods and nodes inline. Pods show Running, Succeeded, Pending, or Failed; nodes show Ready or Not Ready; and the rolled-up health policy shows Healthy, Critical, or Unmonitored.
- Review correlated infrastructure metrics for the same time window, such as:
- CPU usage / throttling
- Memory pressure
- Restarts
- Node pressure
- Network latency, packet drops, retries
- Spot relationships and patterns using the infrastructure view (for example, host ↔ pod ↔ service) and jump to deeper infrastructure views using View Infrastructure.
Suggested investigation path
- Confirm where the span ran (pod/node/host) and validate the Kubernetes context (namespace/cluster).
- Check for obvious anomalies during the same timeframe:
- high CPU, memory pressure
- pod restarts
- node pressure / noisy neighbors
- Validate network impact (latency, dropped packets, retries) if the issue looks like timeouts or intermittent slowness.
Profiling
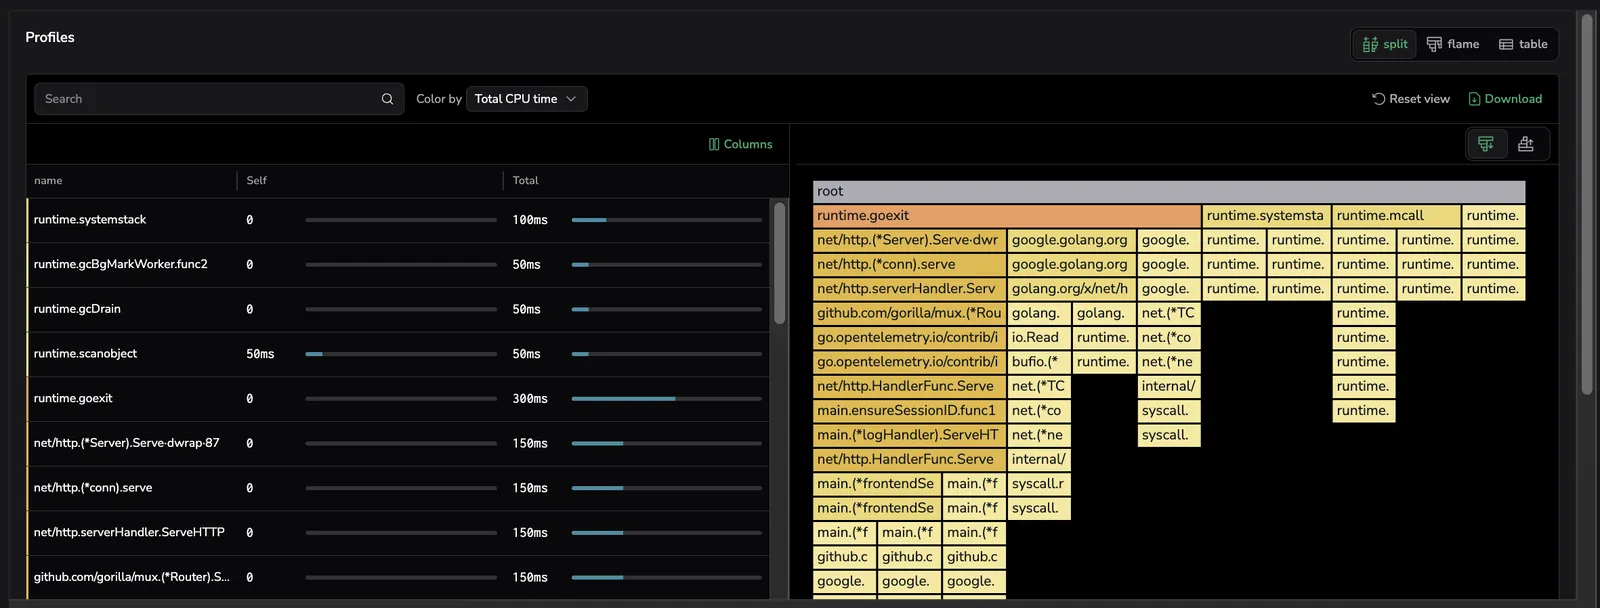
Use this tab to answer: "Where was time spent in code?". Especially when latency is high but logs don’t explain why.
What you can do here
- Review CPU/core activity during the trace timeframe (grouped by service context).
- Inspect profiles (for example, Split/Flame/Table views, depending on what’s enabled).
- Open View Profiling to pivot to the full profiling experience with the same context and timeframe.
Suggested investigation path
- Use Profiling to confirm hotspots, contention, or expensive functions during the trace window.
- Correlate what you see here with the Logs tab to connect a slow path to a specific error or deployment change.
Events
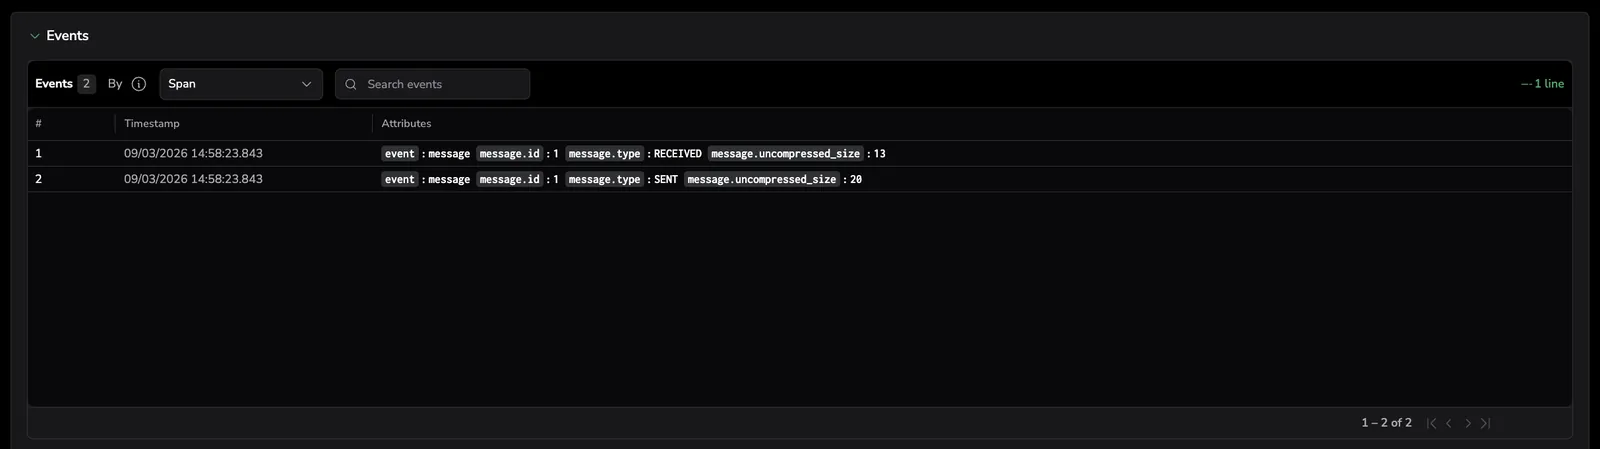
Use this tab to understand "What changed or what occurred during this span/trace" (for example, domain events, operational events, or meaningful attributes captured during execution).
What you can do here
- Switch between Span or Trace scope (Span is usually the tightest context).
- Search within events.
- Review event attributes alongside timestamps to understand sequence and impact.
Suggested investigation path
- Stay in Span scope when you want the tightest context.
- Switch to Trace scope when you want to see related events across the whole request.
AI session
Use this tab when the selected span represents a GenAI or LLM operation. It surfaces the associated AI chat context directly in the trace investigation flow, so you can troubleshoot AI behavior without leaving the drilldown.
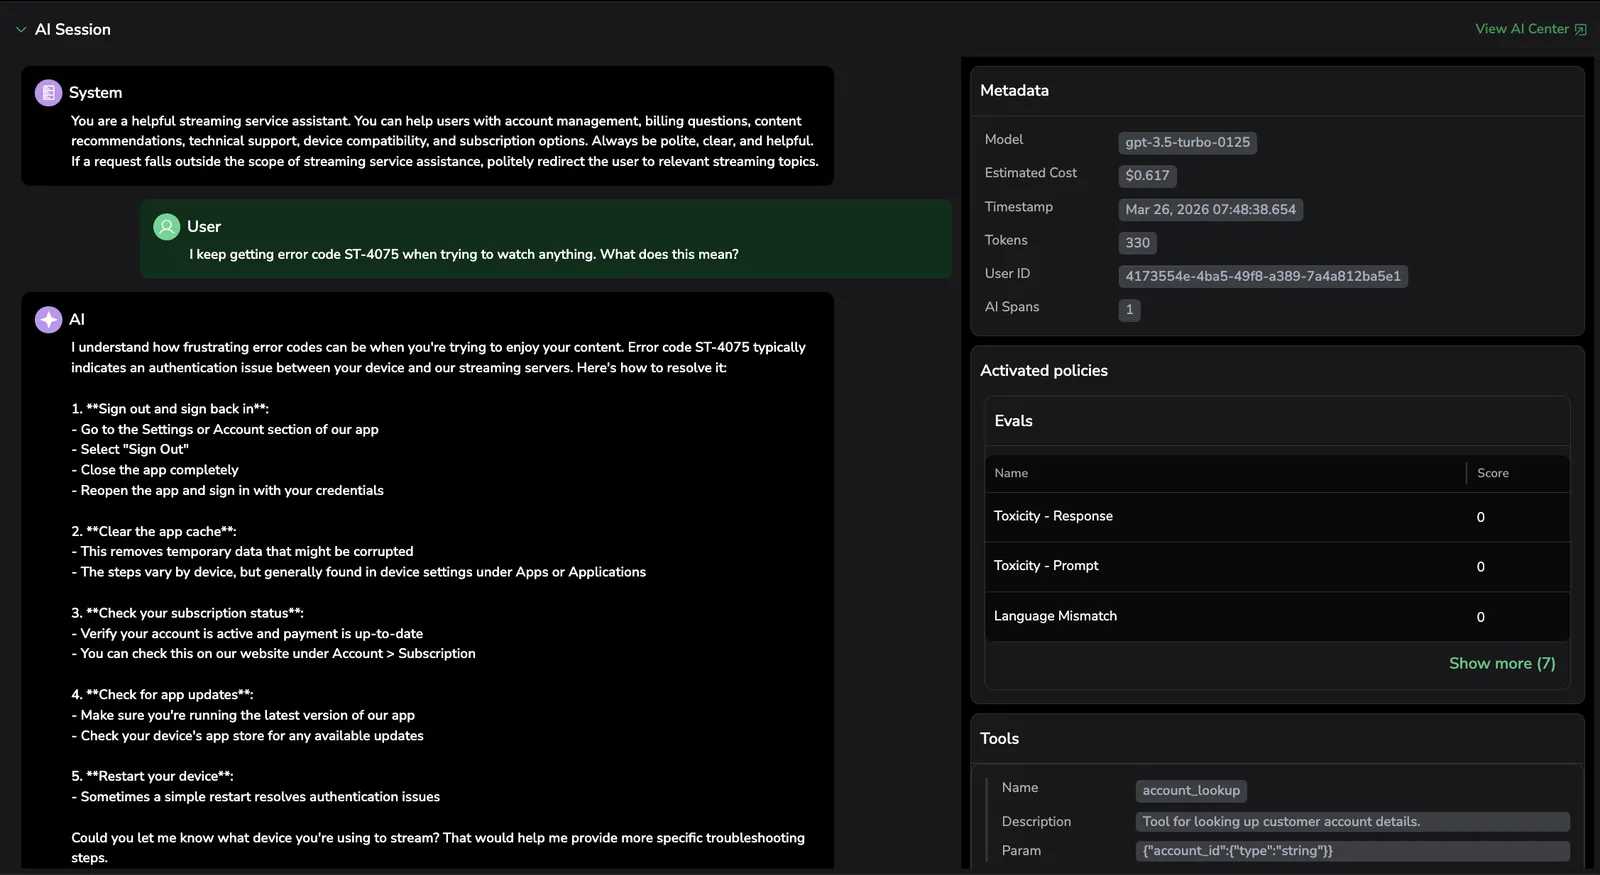
The AI Session tab opens the same tracing drilldown view you see when you select a span in AI Explorer, including the chat, activated policies, metadata, evaluation scores, and tool calls. This lets engineers debug AI behavior in the same place as their backend traces, without switching tools or losing context.
For the complete breakdown of every section in the drilldown (Conversation segments, Metadata, Activated policies, Tools, Guardrails actions, evaluation results), see Inspect a span in detail in the AI Explorer documentation.
Prerequisites
To populate the AI Session tab, your AI application must be instrumented with the Coralogix LLM Tracekit SDK so spans include the GenAI attributes used for correlation. See Getting started with AI Observability for installation and setup.
How correlation works
The AI Session tab appears when a span includes Gen-AI tags that follow the OpenTelemetry Gen-AI Semantic Conventions. Coralogix uses these tags to correlate spans to their associated AI interactions. The specific tags used for correlation may evolve over time as the conventions mature. There are no strictly required tags, the more Gen-AI attributes present, the richer the correlation. Common tags include gen_ai.system, gen_ai.operation.name, gen_ai.model, and gen_ai.request.id.
What you can do here
- Understand what the AI model received and returned.
- Identify incorrect or unexpected outputs.
- Analyze token usage and cost.
- Investigate tool calls and agent behavior.
- Validate response quality using evaluation scores.
- View AI chats linked to the selected span.
- Review Metadata for each chat.
- Review Detect Evals to see evaluation scores. Select Show more to view additional evaluations.
- Review Tools to see the functions called by the AI application during the interaction.
- Select View AI Center to navigate directly to the AI Center for deeper investigation.
Suggested investigation path
- Review the chat content to understand what the AI model received and produced.
- Check metadata (model, tokens, cost) to validate whether the operation behaved as expected.
- Review Detect Evals for quality signals and anomalies.
- Select View AI Center to continue investigation with the full AI Center experience.
Troubleshooting
Some tabs may not appear if the data is not enabled in your account. If Related data is empty (or incomplete), start here.
Logs are missing
- Confirm logs include
trace_id/span_id(or equivalent fields) and service context. - If IDs exist but aren’t extracted, create a parsing rule to extract them.
- If you’re not using OTel, configure the three correlation field mappings (Logs, Span, Service) in Setup Correlations.
Infrastructure is missing
The Infrastructure tab shows one of two empty states, depending on the cause:
- "No Kubernetes or host attributes found for this span": the span carries no
k8s.*,host.*, orcloud.*resource attributes, so there is nothing to resolve. Validate that your instrumentation exports resource metadata (Kubernetes, host, or cloud attributes) consistently, so spans carry the identifiers Coralogix uses to resolve infrastructure. - "No infrastructure metrics found for this span": the span carries recognized attributes, but they didn't resolve to an infrastructure resource with metrics in the window. Common causes:
- The metrics were ingested under a different identity than the span, most often a cluster name that doesn't match between the trace and metrics pipelines. This is the typical case for custom pipelines that don't use the Coralogix Helm chart, where spans and metrics are labeled by separate configurations. Confirm both carry the same cluster, namespace, and pod/node/host values.
- Infrastructure monitoring isn't collecting metrics for that resource. Confirm it's enabled for the resource and reporting around the span's timeframe.
- The resource reported no metrics inside the 15-minute window centered on the span's start time.
If the tab shows a permission message instead of data, you need Infrastructure Explorer read access.
Profiling is missing
- Confirm profiling is enabled for the service.
- Make sure the service name and timeframe align with the trace window.
AI session is missing
- Confirm the span includes Gen-AI tags such as
gen_ai.system,gen_ai.operation.name,gen_ai.model, andgen_ai.request.id. - Confirm the span is correlated to an AI chat in the AI Center.
- For navigation to work, verify that
gen_ai.conversation.idorgen_ai.session.idis present on multi-step interactions.
Summary: how to use related data effectively
- Start with Logs → Errors to find the failure signal fast.
- Check Events to see what changed around the same time.
- Use Profiling to determine whether latency was caused by CPU work, contention, or internal code execution.
- Use Infrastructure to validate runtime impact and resource pressure.
- Use AI Session to troubleshoot AI behavior, then navigate to AI Center if needed.
Next steps
Use trace and span headers to quickly assess issues and pivot to correlated evidence in Headers and quick actions.