Query builder
Query Builder turns log and span search into analysis — group, count, and compare across any field directly in Explore. Start by filtering with the search bar, then add Grouped by and Aggregation chips to turn raw data into grouped results. From grouped results, drill down into a specific group and apply your refined selection back to the main view.
Filter chips
The search bar has 2 input modes: raw Lucene (type queries like serviceName.keyword:"checkly") and chip builder (compose queries from structured chips). Select the wand icon in the search bar — its tooltip reads Switch to chip builder — to toggle from raw Lucene to the chip builder, and select the same icon again to switch back.
In chip builder mode, each filter combines a field, an operator, and a value. When you add a chip, the operator pre-selects the first available option, which is = (Equal) for most fields, so you only need to change it when you want a different comparison. If you change a chip's field, the operator resets to the first available option for that field instead of clearing. This mirrors how the AND connector is the default when you combine multiple filters.
How the builder changes your results
Explore has two table views:
- Rows table: Shows individual logs, spans, or traces that match your search.
- Grouped results table: Appears when you add at least one Grouped by or aggregation, showing grouped rows and calculated metrics.
Build a grouped query
- Use the search bar to filter the logs you care about.
- Select Grouped by and choose one or more fields.
- Select Aggregation and choose one or more aggregations.
- Select Run.
After the query runs, Explore displays a grouped results table. A chart may appear above the table depending on your grouping and time range.
Auto-submit
Builder edits that produce a complete, valid query — adding a chip, accepting an autocomplete suggestion, picking a clause field — auto-submit after a short debounce. Free-text typing in the Lucene editor stages but doesn't auto-submit, and DataPrime is excluded entirely. Use Run when you want explicit control or when typing a multi-clause Lucene expression by hand.
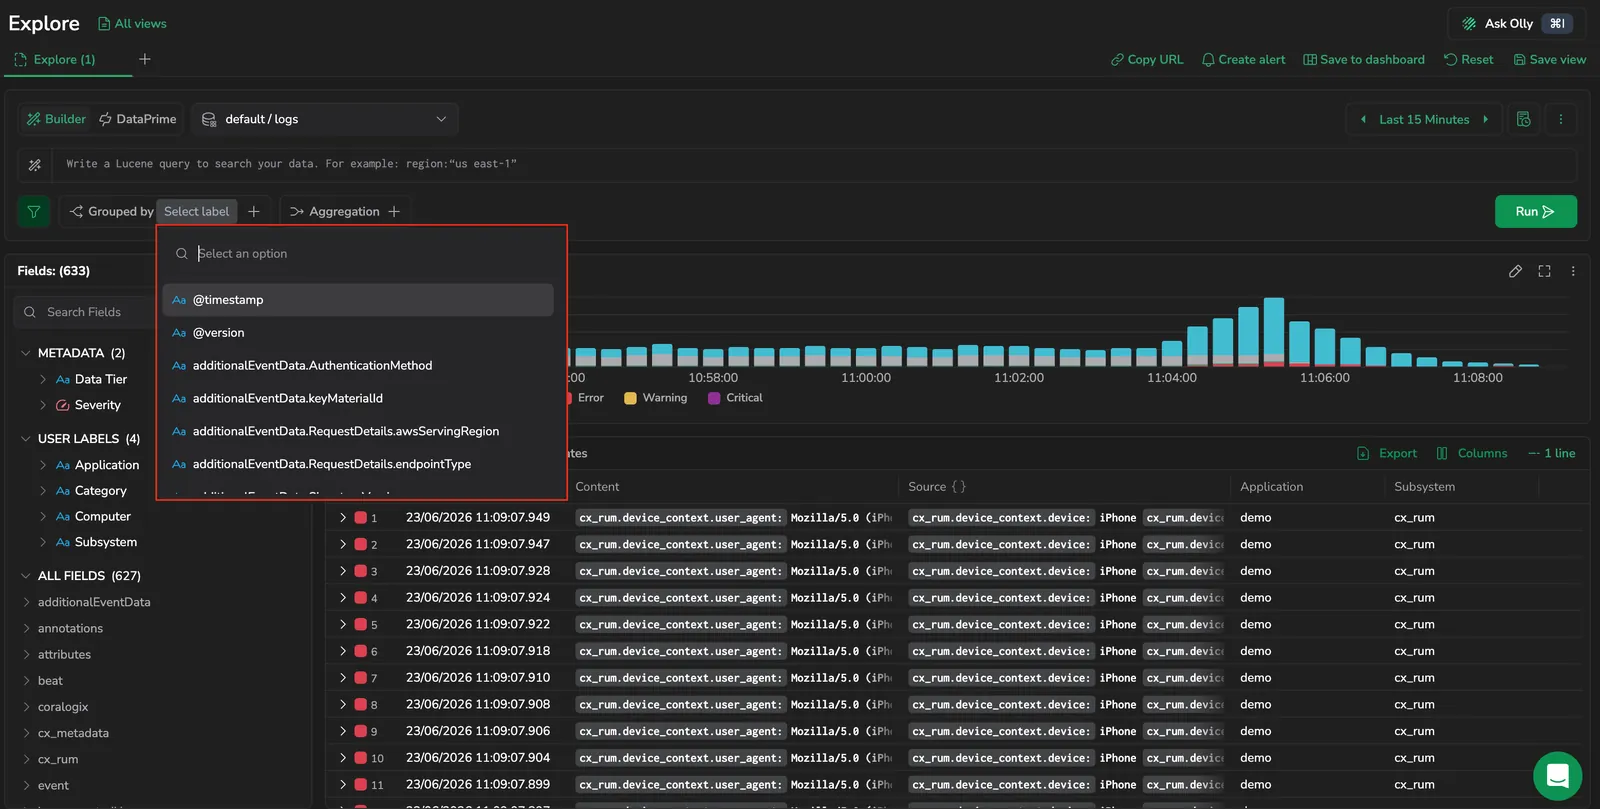
Grouped by fields
Use Grouped by to split results into buckets such as coralogix.metadata.severity, service, or cx_rum.page_context.page_fragments.
Key behaviors:
- You can add multiple group-by fields. The order matters and defines the grouping hierarchy.
- High-cardinality fields can increase query cost and make results harder to read. Use them when you need a deep breakdown, then drill down and narrow the time range.
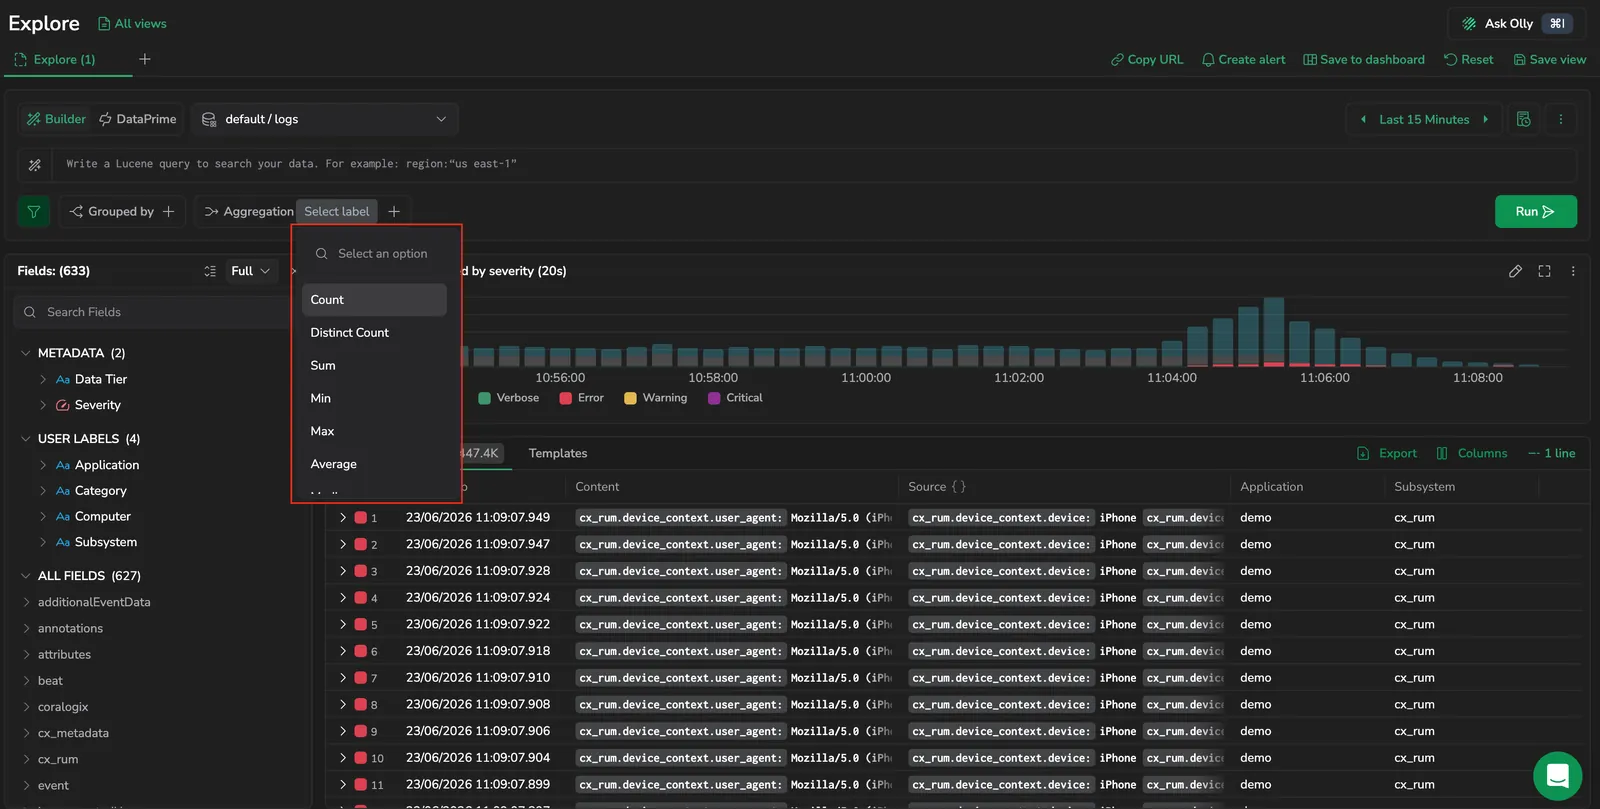
Aggregations
Aggregations calculate metrics per group. The full set of options is:
- Count, Distinct Count
- Sum, Min, Max, Average, Median
- P75, P90, P99
Sum, Min, Max, Average, Median, and the percentiles require a numeric field. When you choose one of these aggregations, select the numeric field to aggregate.
If a group does not contain the selected numeric field, the result cell for that group is empty. This is expected when only some logs include the field.
You can add multiple aggregations to show several metrics as columns side by side.
Order by and Limit
Once you've grouped or aggregated, two chips alongside Grouped by and Aggregation shape the result set:
- Order by: pick any grouped field or aggregation column, then choose Ascending or Descending. Descending surfaces the busiest groups; ascending with a small limit surfaces quiet outliers.
- Limit: caps the number of rows returned. Options are 10, 50, 100 (default), 500, 1000.
Both chips affect the Overview tab only — they don't reshape the raw Logs or Templates tabs.
Visualize the grouped result
Adding a Grouped by or Aggregation clause auto-switches the result panel to the Overview tab, and the Visualize as dropdown appears in its toolbar. The dropdown switches between Table (default), Vertical bar, Horizontal bar, and Pie chart. Until you submit a Grouped by or Aggregation clause, the dropdown stays inactive and its tooltip reads Use Group By in the Builder to unlock additional visualizations. The dropdown only appears on the Overview tab — the Logs and Templates tabs stay row-based regardless of grouping. See Overview tab for logs for the full visualization model.
Drill down into grouped results
When you select a row in the grouped results table, Explore opens a drilldown panel. The drilldown panel is separate from the log details panel — it provides a focused investigation view for the selected group rather than details for a single log entry.
This view helps you inspect the logs and spans that make up the selected group and refine further.
In the drilldown view, you can:
- Review a time distribution chart for the selected group.
- Highlight a time window on the chart to narrow the drilldown results to that interval.
- Apply additional filters using the drilldown search bar.
- Select Apply to main to continue investigating in the main Explore view.
Current behavior of Apply to main:
- It replaces the main view query with the drilldown query, including any filters you added in the drilldown view.
- If you changed the time range in the drilldown view, the main time range updates to match.
Examples
Count logs by severity
- Search:
coralogix.metadata.severity:* - Grouped by:
coralogix.metadata.severity - Aggregation:
Count
Find where errors occur by page
- Search:
errors AND coralogix.metadata.severity:"Error" - Grouped by:
cx_rum.page_context.page_fragments - Aggregation:
Count - Optional filter to exclude missing values:
_exists_:cx_rum.page_context.page_fragments
Break down errors by organization, page, and user
- Search:
errors AND coralogix.metadata.severity:"Error" - Grouped by (in order):
cx_rum.labels.organization_namecx_rum.page_context.page_fragmentscx_rum.session_context.user_email
- Aggregation:
Count
Tips and troubleshooting
- You can also add a grouping directly from the Fields sidebar by right-clicking a field and selecting Add as Grouping. This adds the field to the Grouped by clause without opening the Grouped by dropdown.
- Start with a shorter time range while building your query, then expand after results look correct.
- If grouping produces too many rows, add fewer group-by fields, use a limit, or drill down into one group and narrow the time range.
- If an aggregation shows
null, confirm the aggregated field exists on the logs in that group and that the field is numeric for numeric aggregations.
Next steps
Discover and apply field-based filters without typing field names manually in Filter with fields.