Analyze log patterns with templates
Use templates to group high-volume logs into recurring patterns so you can quickly identify new, rare, and abnormal errors, reduce noise during investigations, and operationalize error discovery with alerts and automation.
Templates are the current name for what was previously called Loggregation.
Use templates to:
- Identify newly introduced and rare errors
- Reduce log noise without losing access to raw data
- Investigate error patterns across applications, subsystems, and infrastructure
- Automate detection of new error patterns after deployments
How templates work
What a template represents
A template represents a recurring log pattern. Coralogix evaluates incoming logs and groups messages that share the same constant structure into a single template. Each template acts as a compact summary of many similar log entries, allowing you to reason about behavior at the pattern level instead of inspecting individual lines.
Templates are scoped by application, subsystem, and severity. This scoping keeps patterns meaningful by grouping logs only within the same operational context.
How variables shape a pattern
Each log message is made up of constant text and variable values. The constant text defines the shape of the message, while variable values change between occurrences. Coralogix uses the constant parts to identify patterns and replaces the changing values with placeholders.
For example, the following log messages:
Are grouped into the pattern:
How templates reflect the full log set
Templates represent the full set of logs in the time range you query, making them useful for detecting rare and newly introduced errors. When you investigate patterns, you can assume they represent the complete picture of the logs you queried.
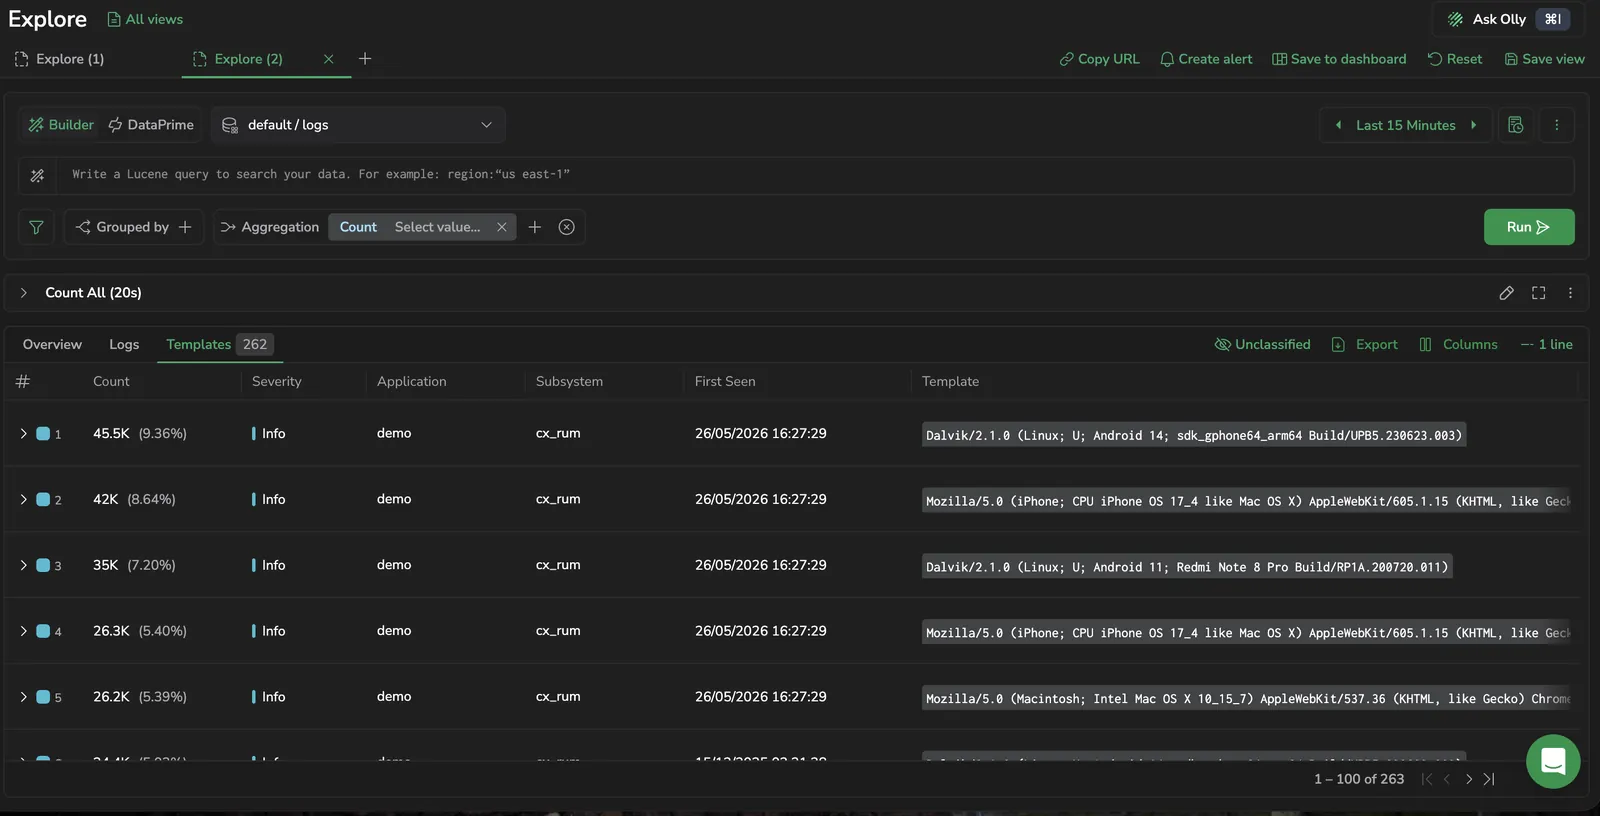
Tabs in Explore
When you run a logs query, the results area exposes three tabs:
- Overview: aggregated tiles, including the Templates across time chart for a quick view of pattern frequency over the query window.
- Logs: individual log entries in sequence.
- Templates: recurring patterns and their frequency.
Switch between tabs without rerunning the query. The view updates as you change the query, filters, or time range.
Note
DataPrime queries do not support templates. Switching to DataPrime from the Templates tab forces a return to the Logs view.
Templates grid columns
The templates grid exposes the following columns:
| Column | Description |
|---|---|
| Count | Number of log entries matching the pattern. The cell also shows the ratio of total logs as a secondary value. |
| Severity | The severity associated with the template branch. |
| Application | The application associated with the template branch. |
| Subsystem | The subsystem associated with the template branch. |
| First Seen | Timestamp of when the pattern first appeared. |
| Template | The log template with variable placeholders. |
Sort the table by any column to prioritize which patterns to investigate.
Find new and rare errors
Surface rare errors using low-occurrence sorting
Sort the templates grid by Count ascending to uncover rare patterns. These often indicate edge cases, regressions, or early signs of larger issues that would be easy to miss in raw logs.
Identify newly introduced errors using First Seen
Sort by First Seen to find patterns that appeared recently. This is especially useful after deployments or configuration changes — use First Seen to confirm whether an error pattern existed before the change window or was introduced afterward.
Uncover logs not yet templated
Not all logs immediately belong to a template. To find new or unusual messages that have not yet formed a stable pattern, select the Logs tab and run:
This helps you catch newly introduced errors before they become frequent enough to form a template.
Investigate a specific pattern
Select any pattern row to open the Template details info panel.
The panel header shows the Template ID (the stable identifier for the pattern — use it as a filter in other queries), a Severity badge, and Application / Subsystem tag chips.
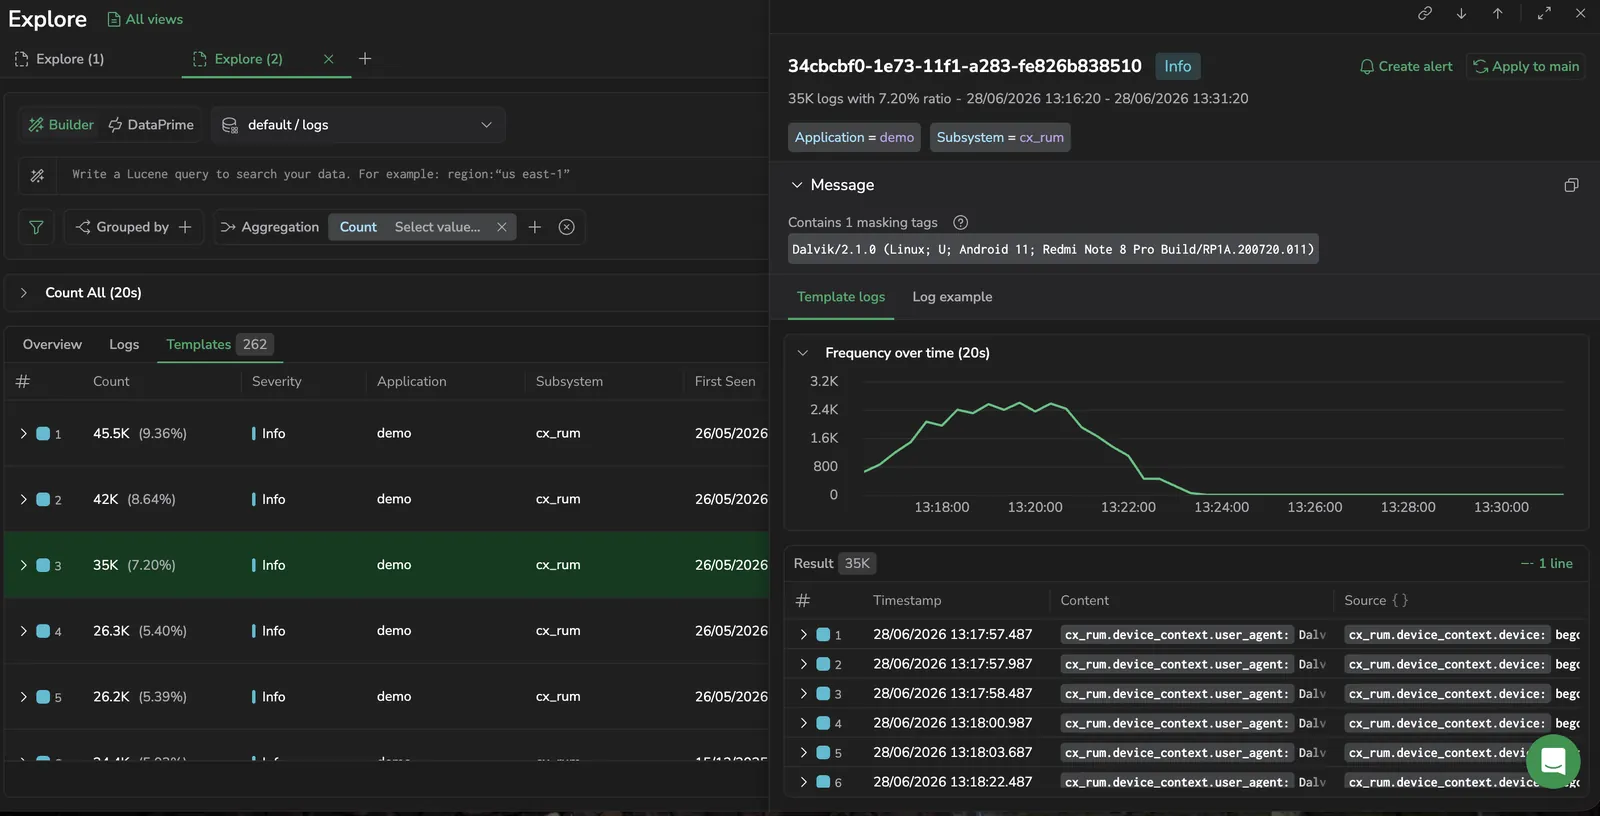
Below the header, the Message section displays the template message with variable placeholders rendered as masking-tag chips. The section indicates how many masking tags the template contains.
Beneath the Message section, the panel has two tabs:
- Template logs (default): shows a Frequency over time chart of how often the pattern occurs across the query window, plus a table of matching log entries with a result count.
- Log example: shows a single sample log entry that matches the pattern, in Table, JSON, or Raw view. In Table view, use the Search table field to filter the visible fields.
From the panel header you can:
- Select Apply to main to append
coralogix.templateId:"<id>"to the main query and filter the Logs view to only entries matching this template. - Select Create alert to monitor the pattern automatically. Configure the alert conditions and notification settings in the dialog.
Combine template ID with Lucene filters
Narrow your investigation by combining a template ID with additional Lucene filters, such as server, environment, or metadata fields. This helps you understand how a pattern behaves across different parts of your system.
Reduce noise during active investigations
Unclassified templates can obscure more important signals. Select Unclassified in the templates grid toolbar to hide unclassified logs from the current view. The button is a toggle — select it again to show them. Hiding a template from view does not delete data — all underlying log entries remain fully searchable.
To remove other templates from view, filter them out with Lucene.
Create alerts on patterns
To monitor a pattern automatically:
- Open the Template details info panel by selecting a pattern row.
- Select Create alert in the panel header.
- Configure the alert conditions and notification settings.
You can also configure alerts that trigger when new templates appear, enabling proactive detection of new error patterns without manually inspecting logs. This is especially useful after deployments.
Automate error detection workflows
The Insights API lets you query and analyze log patterns programmatically. Use it to fetch top errors, most recent errors, and other actionable data.
A common automation pattern is to run a post-deployment check that looks for newly introduced templates or errors after a short delay, then send notifications to external systems such as Slack for fast feedback.
Limits
| Limit | Value |
|---|---|
| Template branches | 1,000 maximum (defined by application, subsystem, and severity) |
| Logs per branch | 10,000 logs per template branch |
| Template retention | Up to 90 days after the last matching log |
New templates are created only after a pattern reaches a defined occurrence threshold, preventing unstable messages from forming misleading templates too early.
Unclassified logs
Logs may remain unclassified when message fields have very high cardinality, when messages are excessively long, or when their structure prevents reliable pattern extraction. Unclassified logs are not dropped — they remain fully visible and searchable.
Filter for unclassified logs with NOT _exists_: coralogix.templateId. Use branch-level details to identify root causes and decide whether parsing, normalization, or logging changes are needed.