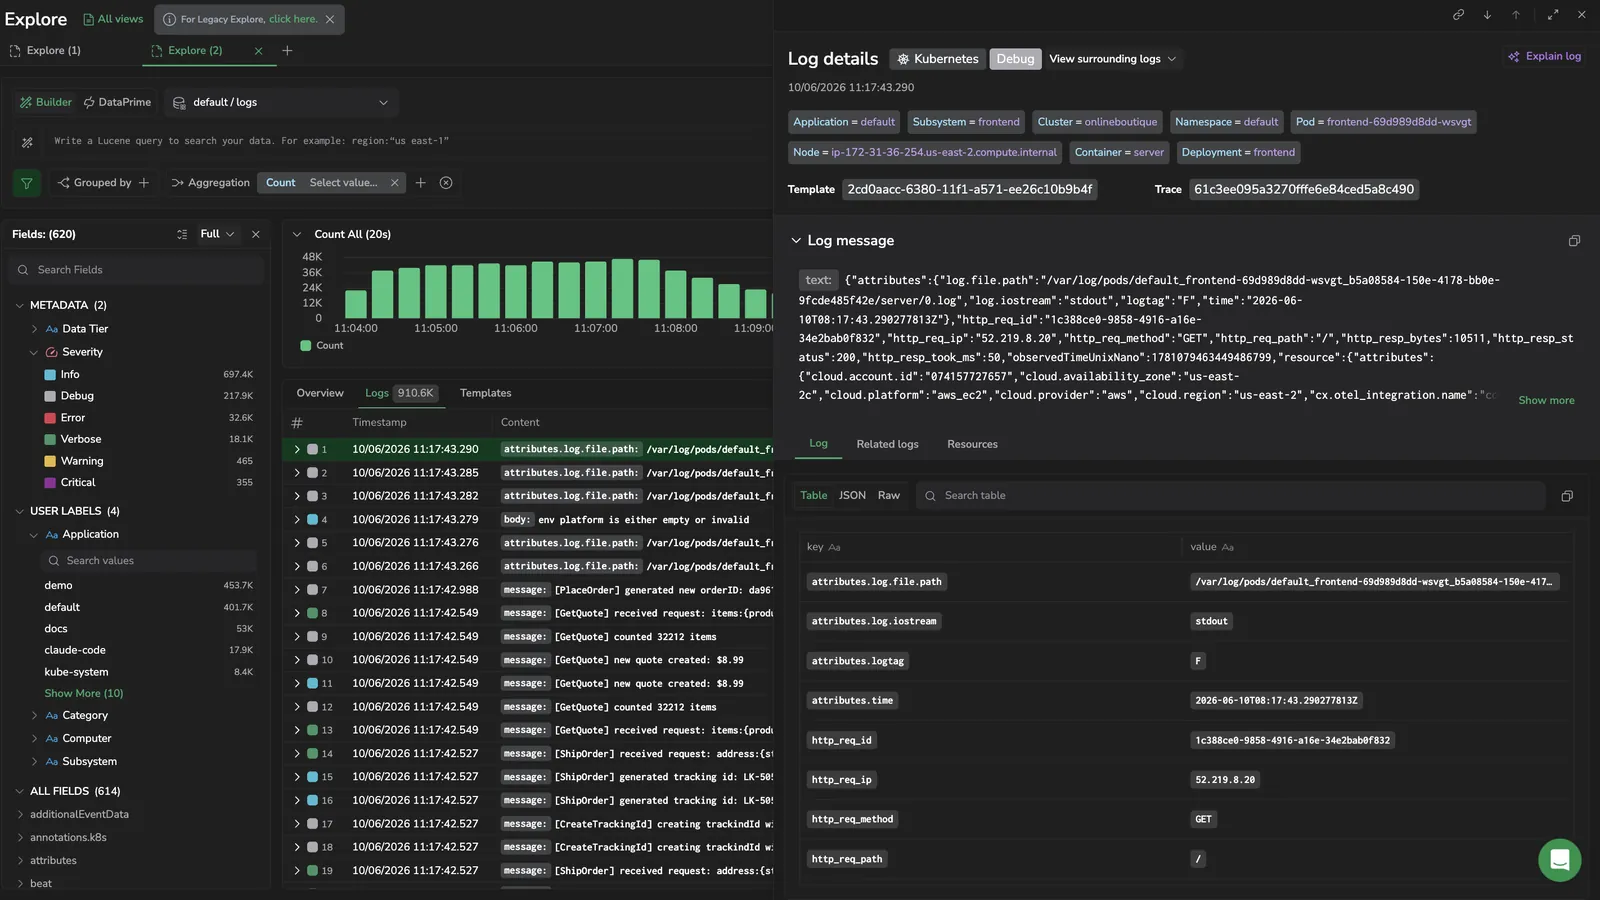
Log details panel
The log details panel opens when you select a log entry in the Explore results table. It displays the full record for the selected log, including all fields, metadata, and related observability data.
Use the log details panel to inspect a single event in depth, filter your investigation based on specific field values, and navigate to related logs, traces, and metrics.
Use cases
- Review the full field set of a log entry without switching screens.
- Filter the Explore results to include or exclude specific field values found in a log.
- Correlate a log event with its associated trace, span, or resource metrics.
- Understand the context of an error by viewing surrounding log entries.
What you need
- Access to Explore with at least read permissions for the relevant dataset.
- Log data ingested into Coralogix.
Open the log details panel
- In Explore, run a query to return log results.
- Select any log row in the results table.
The panel opens on the right side of the screen. The selected row is highlighted in the table.
To close the panel, select the X, select the same row again to toggle it off, or select a column header, the toolbar, or an empty area of the grid. To keep the panel open while browsing results, use the navigation arrows within the panel to move between log entries.
When you arrive in Explore from a Deep link that targets a specific log, the info panel opens automatically — even if that log isn't in the current grid (for example, because the query has changed since the link was created). If the log can no longer be loaded, the panel shows a Log not found empty state instead of the record.
Resize the panel
Select Expand to full width in the panel header to maximize the panel across the viewport when you need more room to read a structured log or compare fields. Select Exit full width to return to the default width. The same toggle is available on the Templates info panel.
Log context and labels
The panel header shows the log's context as compact visual elements rather than labeled rows:
- A color-coded severity badge indicates the log severity level (for example, Error, Warning, Info).
- The timestamp appears as a formatted string next to the badge.
- Application and Subsystem appear as
key = valuechips. Selecting a key or value chip opens the standard key/value context menus (see Row actions). - A Trace ID chip appears when the log carries a trace ID. Select it to open the span drawer for that trace.
- A Template ID chip appears when the log belongs to a template. Select it to open the Templates info panel.
Tabs in the panel
The panel has three tabs below the header:
- Log: the full record view, with the log message and field list.
- Related Logs: finds logs with similar attributes around the same time. Pick which attributes to match.
- Resources: infrastructure attributes and resource metric charts for the log's host or service. If the log doesn't carry infrastructure context, the tab shows an empty state.
View surrounding logs
Use the View surrounding logs dropdown in the panel header to load logs from the same source within ± a duration of the selected event. Choose a duration preset:
- 5 Seconds
- 30 Seconds
- 1 Minute
- 5 Minutes
- 10 Minutes
The Explore results refresh with the surrounding window and center on the selected log. The same action is also available from the row actions menu in the logs grid.
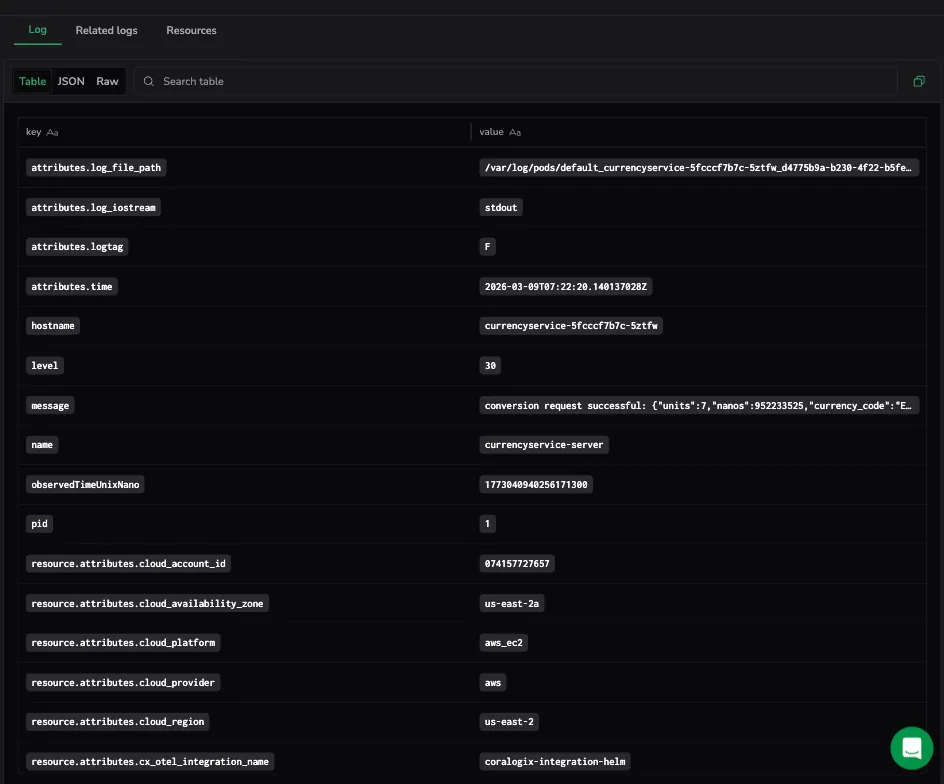
Log tab
The Log tab shows the log message and field list with three view modes:
- Table: fields rendered as rows of key/value pairs. Use the Search table field to filter the visible rows; matching text is highlighted.
- JSON: the log rendered as formatted JSON.
- Raw: the unprocessed raw message text.
The Log message section sits at the top of the tab. Use Show more / Show less to expand truncated messages, and the copy button to copy the message text.
Row actions
Selecting a field name or value in the panel opens the same context menus described in Logs table — see Key menu and Value menu for the full action lists. The same key/value menus open from the Application and Subsystem tag chips in the panel header.
Related logs tab
The Related Logs tab surfaces logs with similar attributes around the same time. Pick which attributes to match (for example, application, subsystem, host) to scope the search. Use this tab to widen the lens from a single log to its neighborhood without leaving the panel.
Resources tab
The Resources tab shows infrastructure attributes and resource metric charts for the host or service associated with the log. Use it to confirm whether an error coincided with resource exhaustion, container restarts, or other infrastructure events.
If Coralogix doesn't detect any infrastructure context for the log, the tab shows an empty state ("We didn't find infrastructure attributes or metrics for this log").
Explain log
The Explain log feature uses AI to generate a plain-language explanation of the log message. Use it to quickly understand unfamiliar log formats, error codes, or cryptic messages without leaving the panel.
Select Explain log in the panel header, next to the title. The explanation opens in an AI panel within the same drawer.
Note
Explain log is an AI-powered feature. Review the explanation in context of your system and do not rely on it as a definitive root-cause analysis.
Send the log to Olly as data context
Select Add to Olly context in the panel header — next to Explain log — to open the Olly chat with this log attached as a data-context chip. Use this when you want to ask Olly a custom question about the exact log, instead of a quick AI summary.
The chip is labelled with the log's timestamp, with a tooltip that reads Log: \<timestamp>. You can add more logs from the Logs table or spans from the trace drilldown; each record becomes its own chip. See Page and data context for chip behavior.
Share the panel state
Select the Share URL link icon in the panel header to copy a shareable URL that recreates the current query, time range, and selected log.
Navigate between logs
Use the navigation controls at the top of the panel to move between log entries without closing the panel:
- Select the up arrow (tooltip Previous Log) to move to the previous log entry in the results table.
- Select the down arrow (tooltip Next Log) to move to the next log entry.
The results table scrolls to keep the selected row visible as you navigate.
Next steps
Switch from raw rows to aggregated views in the Overview tab for logs.