Export data
Export data downloads the results of an Explore query as a CSV, TSV, or JSON file. The same export drawer is available from every grid in Explore V2 — the Logs and Spans tabs, the Traces and Templates tabs, and the Overview tab that renders aggregated rows when your query includes a Group By — so you can share investigation results outside Coralogix, run analysis in spreadsheets or notebooks, feed downstream tooling that consumes JSON, archive a snapshot for compliance, or hand off samples to teammates without a Coralogix login.
Choose a data-selection mode
Choose based on how you plan to use the file:
- Pick Grid columns when you want a clean CSV, TSV, or JSON file shaped by what's visible on screen. Each grid column becomes a column (CSV/TSV) or a top-level key (JSON) in the file.
- Pick All logs (or All spans when exporting from the Spans tab) when you need every field per record for analysis, archival, or downstream tooling. The file is denser and not optimized for spreadsheets — JSON is the most natural format here.
If in doubt, Grid columns is the safer default.
Where to export from
| Surface | What gets exported | How it runs | Formats |
|---|---|---|---|
| Logs tab | Logs matching your current query and time range, up to 10,000 rows | Server-side export through the Coralogix export service | CSV, TSV, JSON |
| Spans tab | Spans matching your current query and time range, up to 10,000 rows | Server-side export through the Coralogix export service | CSV, TSV, JSON |
| Traces tab | The traces currently loaded in the grid | Client-side export of the rows on screen | CSV, TSV |
| Templates tab | The templates currently loaded in the grid | Client-side export of the rows on screen | CSV, TSV |
| Overview tab | The aggregated grid rows as displayed (not the raw underlying events) | Client-side export of the rows on screen | CSV, TSV |
The Logs and Spans exports run against the backend, so they include every matching record up to the export cap regardless of grid paging. The Traces, Templates, and Overview exports run client-side and include only the rows already loaded into the grid — scroll or load more before exporting if you need additional rows. Client-side exports support CSV and TSV only; JSON is exclusive to the server-side Logs and Spans exports.
Export from the Overview tab
The Overview tab opens whenever your query produces grouped or aggregated results — that is, when the query includes:
- An aggregation (for example,
count,sum,avg). - A grouping (a Grouped by clause in Builder mode, or a
groupbyoperator in DataPrime mode). - Both an aggregation and a grouping.
The Overview tab renders the resulting rows in a grid, and the Export button at the top of that grid downloads those rows as CSV or TSV. The export reflects the grid exactly as displayed — column names and values match what you see on screen — not the raw underlying events that produced the aggregation.
Export from the DataPrime Results table
DataPrime queries land in a single Results tab (the Builder-mode tabs aren't shown), but the export drawer routes through the same paths:
- A non-aggregation DataPrime query (no
groupby … aggregate …) exports server-side, the same as the Logs or Spans tab — CSV, TSV, or JSON, up to 10,000 rows. - An aggregation DataPrime query exports client-side, the same as the Overview tab — CSV or TSV only, scoped to the rows currently loaded in the grid.
Open Export from the top-right of the Results table to open the same dialog used by the Builder-mode surfaces.
How to export
- Run a query so the grid contains the logs or spans you want.
- Open Export from the right corner.
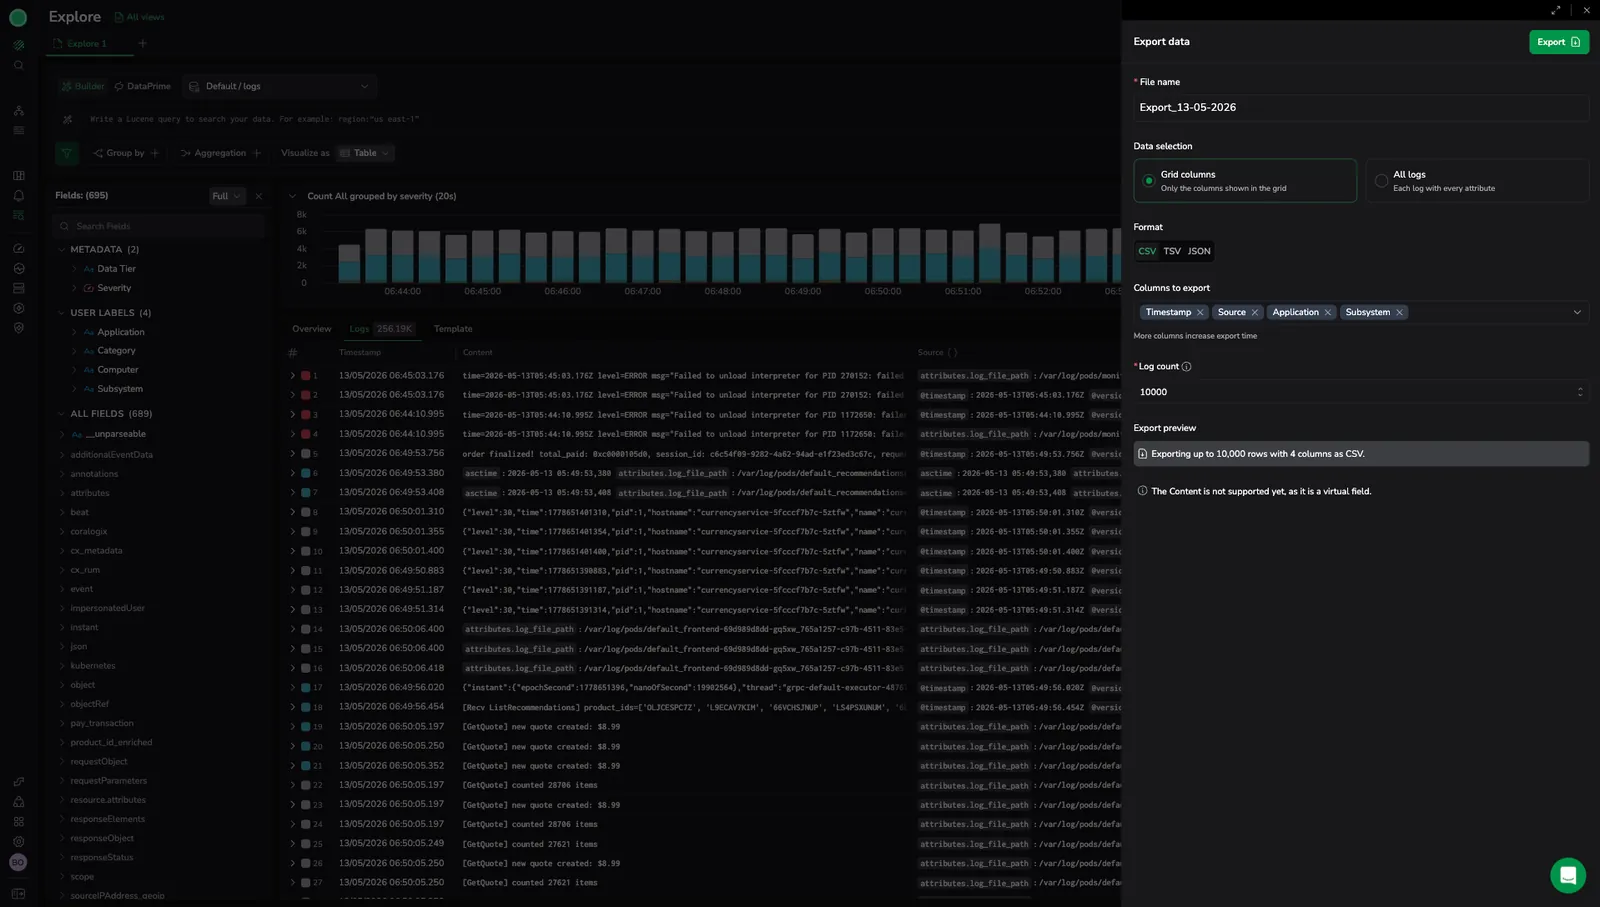
- Choose a data-selection mode (Grid columns or All logs / All spans).
- Choose a format: CSV, TSV, or JSON.
- Adjust the row count if needed. Default and cap are both 10,000.
- Select Export. The file downloads to your browser.
Default columns differ by tab:
- The Logs tab defaults to exporting
Timestamp,Source,Application, andSubsystem. - The Spans tab defaults to exporting
Timestamp,Service,Operation,Duration, andSpan ID.
Add or remove columns under Columns to export before you export.
The dialog suggests a default file name in the format Export_DD-MM-YYYY (for example, Export_22-06-2026). To customize it, enter letters, numbers, and ., _, or - only — up to 255 characters. Other characters show the error Only letters, numbers, and the characters . _ - are allowed and the Export button stays inactive until you fix the name.
How exported data maps to the grid
Most columns in the grid map directly to a single backend field, and they appear in the export with the same name and value. A few columns are different.
Virtual columns
A small number of columns are built in the UI from several raw fields, with fallbacks and normalization across SDKs and sources. They are not stored as a single field on the backend, so they are not included in the export.
| Surface | Virtual column | Source fields |
|---|---|---|
| Logs | content | message, log, body, event, and similar fields |
| Spans | resource | Resource attributes (varies by SDK and instrumentation) |
| Spans | status_code | http.status_code, rpc.grpc.status_code, and semantic-convention equivalents |
| Spans | span_kind | SERVER, CLIENT, PRODUCER, CONSUMER, INTERNAL (derived from span.kind) |
If you add a virtual column under Columns to export, the file will not contain a column with that name. The Spans tab export drawer also shows an inline note: "Kind, Resource and Status are not supported yet, as they are virtual fields." To capture the same information:
- Pick All logs or All spans to export every raw field, then derive the equivalent column yourself in your spreadsheet or notebook.
- Or select the underlying source fields directly in Columns to export before exporting.
Limitations
| Area | Limit |
|---|---|
| Maximum rows per export | 10,000 |
| Supported formats | CSV, TSV, and JSON on the Logs and Spans tabs (server-side exports). CSV and TSV only on the Traces, Templates, and Overview tabs (client-side exports). JSONL and Parquet are not supported on any tab. |
| Delivery | Direct browser download only. No email, S3, or background delivery. |
| Execution | Synchronous only. Closing the dialog or navigating away cancels the export. |
| API and Terraform | Not available. Export is UI-only. |
| Scheduling | Not available. Each export must be triggered manually. |
| Truncation | If the query returns more than 10,000 rows, only the first 10,000 are included. There is no warning beyond the row-count cap shown in the dialog. |
| Datasets | Logs and spans. Metrics are not supported. |
| Virtual columns | Span kind, Resource, and Status are not supported in spans exports — they are derived in the UI rather than stored as backend fields. |
Troubleshoot
| Problem | Cause | Resolution |
|---|---|---|
| File contains fewer rows than expected | The query returned more than 10,000 rows and the export was capped. | Refine the query or shorten the time range to fit within 10,000 rows, or run multiple exports across smaller windows. |
| Column shown in the grid is missing from the file | The column is a virtual column built by the UI (for example, content for logs or resource, status_code, and span_kind for spans). It does not exist as a single backend field. | Pick All logs or All spans to export every raw field, or select the underlying source fields explicitly in Columns to export. |
| Spreadsheet shows JSON in cells | All logs or All spans was selected with a CSV or TSV format, so nested objects are serialized into cells. | Re-export with Grid columns, or switch the format to JSON if you want the nested structure preserved. |
| Special characters break the spreadsheet layout | The data contains commas that conflict with the CSV separator. | Re-export with TSV. |
| Export is empty | The query returned no results. | Adjust the query, filters, or time range so the grid shows results before exporting. |
| Browser download is interrupted | The page was navigated away during the server-side export job. The dialog closes as soon as you select Export — the file is delivered when a success toast appears, so leaving Explore before the toast cancels the download. | Stay on the Explore page until the success toast appears. |