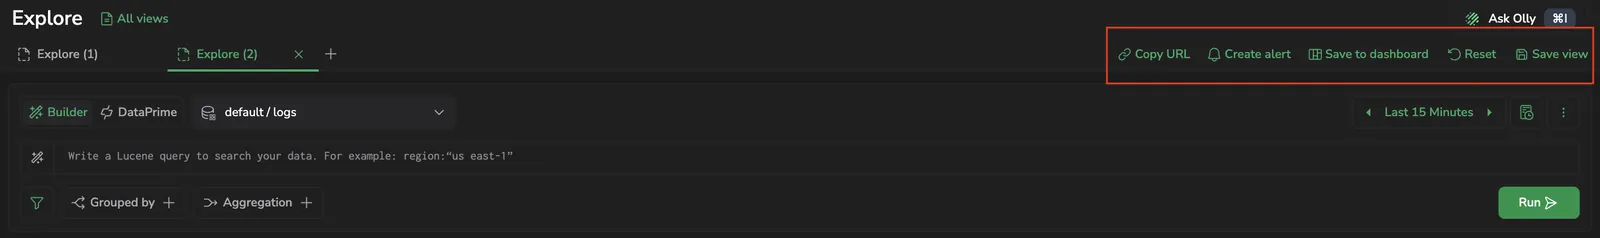
Explore actions
The actions in the top-right corner of the Explore screen apply to the current view and query configuration. Use them to share your investigation, alert on a pattern you have found, send a chart to a Custom Dashboard, save the current configuration as a view, or reset and start fresh.
The toolbar lists up to five actions: Copy URL, Create alert, Save to dashboard, Reset, and Save view (which becomes Save changes once the tab has been saved as a view). Save view / Save changes appears only if you have the Manage permission on saved views.
Copy URL
Generate a shareable link that preserves the current query, filters, time range, and view state. Anyone who opens the link loads the same Explore configuration.
The link is human-readable: every value is a plain query parameter (for example, ?query=…&dataset=…&duration=…), so you can hand-edit it or build new links from scratch. For the full parameter reference, see Deep links and URL parameters.
Create alert
Create an alert based on the current query. Use this when a query reveals a pattern you want to monitor automatically, such as recurring errors or abnormal log volume.
The alert editor opens prefilled with the current Lucene query as a threshold alert on logs. The threshold condition is left empty — set it explicitly before saving.
Save to dashboard
Send the current Explore visualization to a Custom Dashboard as a widget. Use this to promote a chart you built during investigation into a permanent dashboard so the team can monitor it without rebuilding the query.
Selecting Save to dashboard opens the Send to custom dashboard dialog with two tabs.
Info
Custom Dashboards only render high- and medium-tier data. Saving a query that reads from a low-tier dataset — anything outside your frequentsearch dataspace — still creates the widget, but it returns no data on the dashboard until the query targets high- or medium-tier data. For how the frequentsearch dataspace and data tiers work, see Dataspaces.
Save as new dashboard
Creates a new dashboard containing the widget.
- In the dialog, select Save as new dashboard.
- In Dashboard name, enter a name. Coralogix prefills the field with
Explore - <date> <time>. Replace it with something descriptive. - Select Save.
The new dashboard opens with the widget already in place.
Add to existing dashboard
Adds the widget to a dashboard you already own.
- In the dialog, select Add to existing dashboard.
- From the Dashboard dropdown, pick the target dashboard.
- Choose how to place the widget:
- Add as separate widgets. Drops each widget into the dashboard at the top level, alongside existing widgets.
- Add as a new section. Wraps the widgets in a new collapsible section. When you pick this option, enter a Section name to label it.
- Select Save.
How the saved widget behaves
The widget is added to the target dashboard as a Dynamic widget. It keeps the query, filters, time range, and visualization type from the Explore view at the time you save. Editing the original Explore tab later does not change the dashboard widget. To pick up later changes, save again or edit the widget directly on the dashboard.
Dashboard widgets don't support every Explore visualization. When you save a chart whose visualization type isn't supported by Custom Dashboards (for example, Scatter), the widget falls back to a Line chart. Switch to a supported visualization in Explore before saving if you want the widget rendered the same way.
Reset
Reset the current tab. The behavior depends on whether the tab is linked to a saved view:
- On an unsaved tab, Reset clears the query, filters, and grouping settings and restores the default Explore state.
- On a tab loaded from a saved view, Reset reverts the tab to the saved view's stored configuration and discards any unsaved edits.
Saved views and other tabs are not affected either way.
Save view and Save changes
Save the current Explore tab as a saved view so you can return to the same investigation later. The button label depends on the tab state.
- Save view appears on a new, unsaved tab. Selecting it creates a saved view with the current query, filters, time range, layout, and visualization.
- Save changes appears once a tab has been saved as a view and then edited. Selecting it overwrites the existing saved view with your edits.
For full details on what a saved view captures and how to manage views across tabs, see Explore views, tabs, and queries.
Next steps
Turn values from a log or span into clickable jumps to internal tools or third-party services with Custom Actions.