Query builder
Create complex queries easily using the Query Builder in Custom Dashboards.
Overview
Using the Custom Dashboards Query Builder, you can now build queries for your widgets without the burden of knowing the exact DataPrime, Lucene, or PromQL syntax.
Use the Query Builder to create a query
During your widget setup, a query panel will appear in the lower part of the dashboard panel. Toggle between Builder and Query modes.
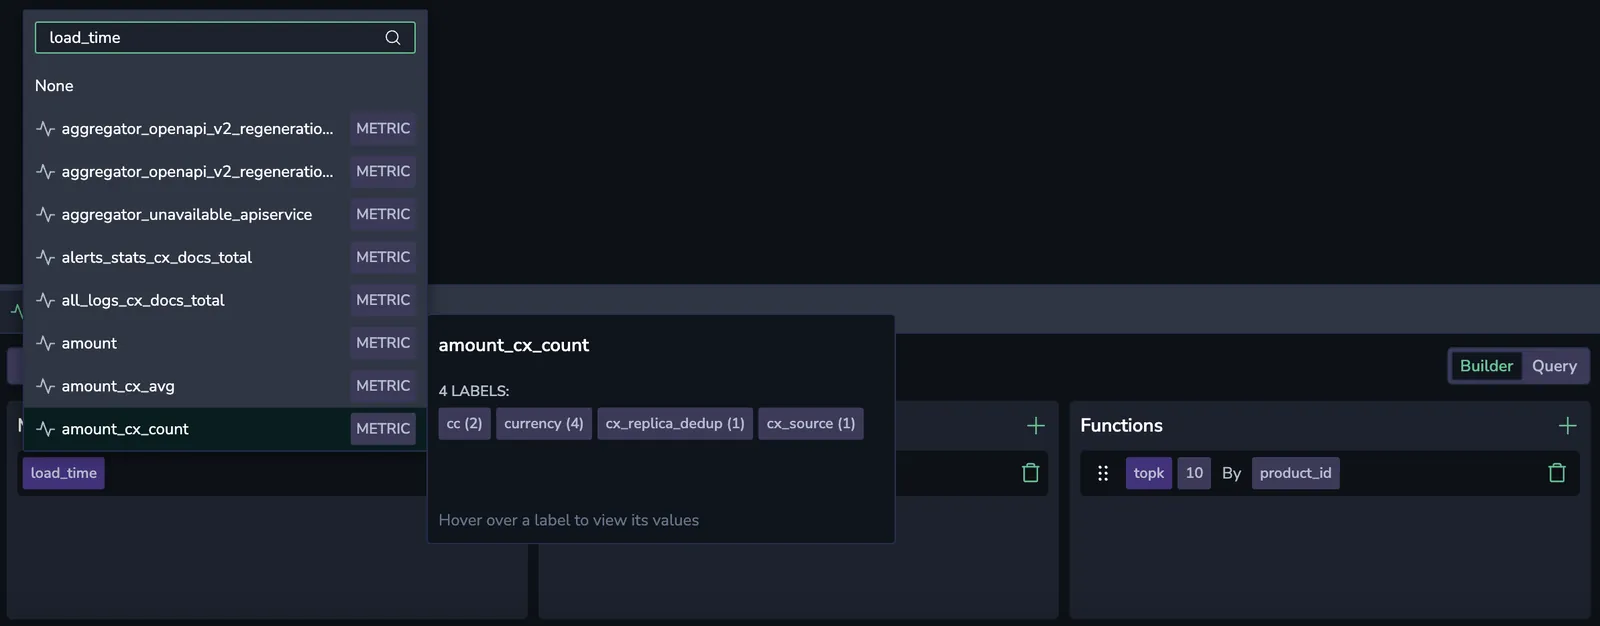
Metrics-based query
Logs-based query
The logs-based Query Builder allows you to create complex queries by crafting Lucene-based queries and then adding filters and functions.
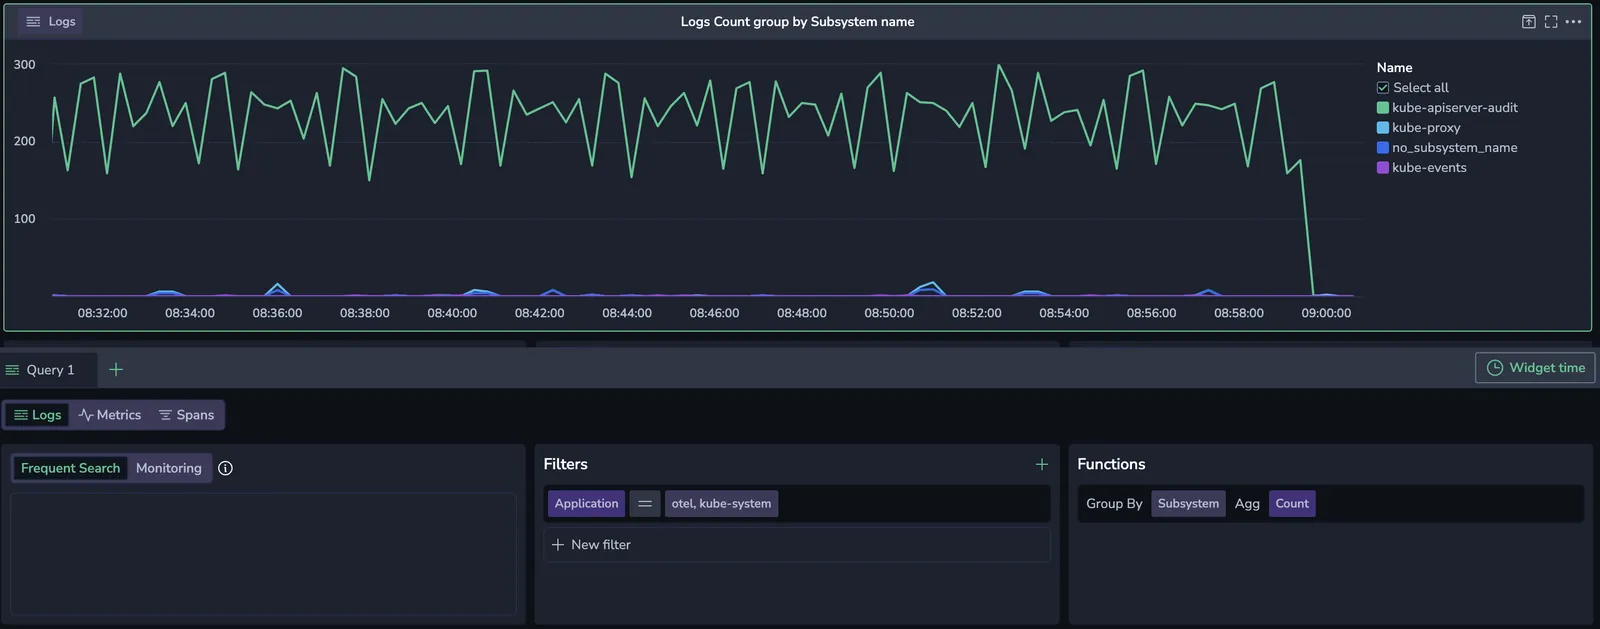
Dashboard widgets support the $l. (label) and $m. (metadata) Lucene field prefixes, matching Explore, e.g. $l.applicationname: "checkout". Both Lucene and DataPrime query modes resolve these fields consistently.
Data source
In Builder mode, select logs as your source.
Data pipeline
Choose to query Frequent Search or Monitoring logs.
Filters
To add a filter, click +. Choose a label and an associated value.
Select the = or != operator from the drop-down menu to include or exclude one or more values, respectively.
Selecting the =~ or !~ operators will allow you to input a regex expression.
To add additional label-value pairs, click the + button.
Functions
To add a function, click +. Show an aggregated value using one of the following functions.
| Function | Description |
|---|---|
| Count | The total number of data points within the selected time range. |
| Count Distinct | The number of unique data points within the selected time range. |
| Sum | The sum of all data points within the selected time range. |
| Min | The smallest value among the data points within the selected time range. |
| Max | The largest value among the data points within the selected time range. |
| Average | The average value of all data points within the selected time range. |
| Percentile XX | Represents the value below which XX% of the data points fall. For example, Percentile 95 is the value below which 95% of data points fall. |
With Group by, you may group query results by one or more fields.
In time-based visualizations, when you use Group By with a timestamp field in logs or spans queries, the widget divides the selected dashboard time range into equal time buckets.
The number of buckets is not fixed. On Auto, the widget derives it from how wide the widget is drawn, at roughly one data point per two pixels, then applies a cap for the data mode and widget type. A wider widget therefore resolves more finely than a narrow one over the same time range.
The cap is 200 data points on Frequent Search, 500 on bar charts, and 1,000 otherwise. Set the interval yourself with Manual, or change the cap under Limits (advanced). See Configure time interval.
Spans-based query
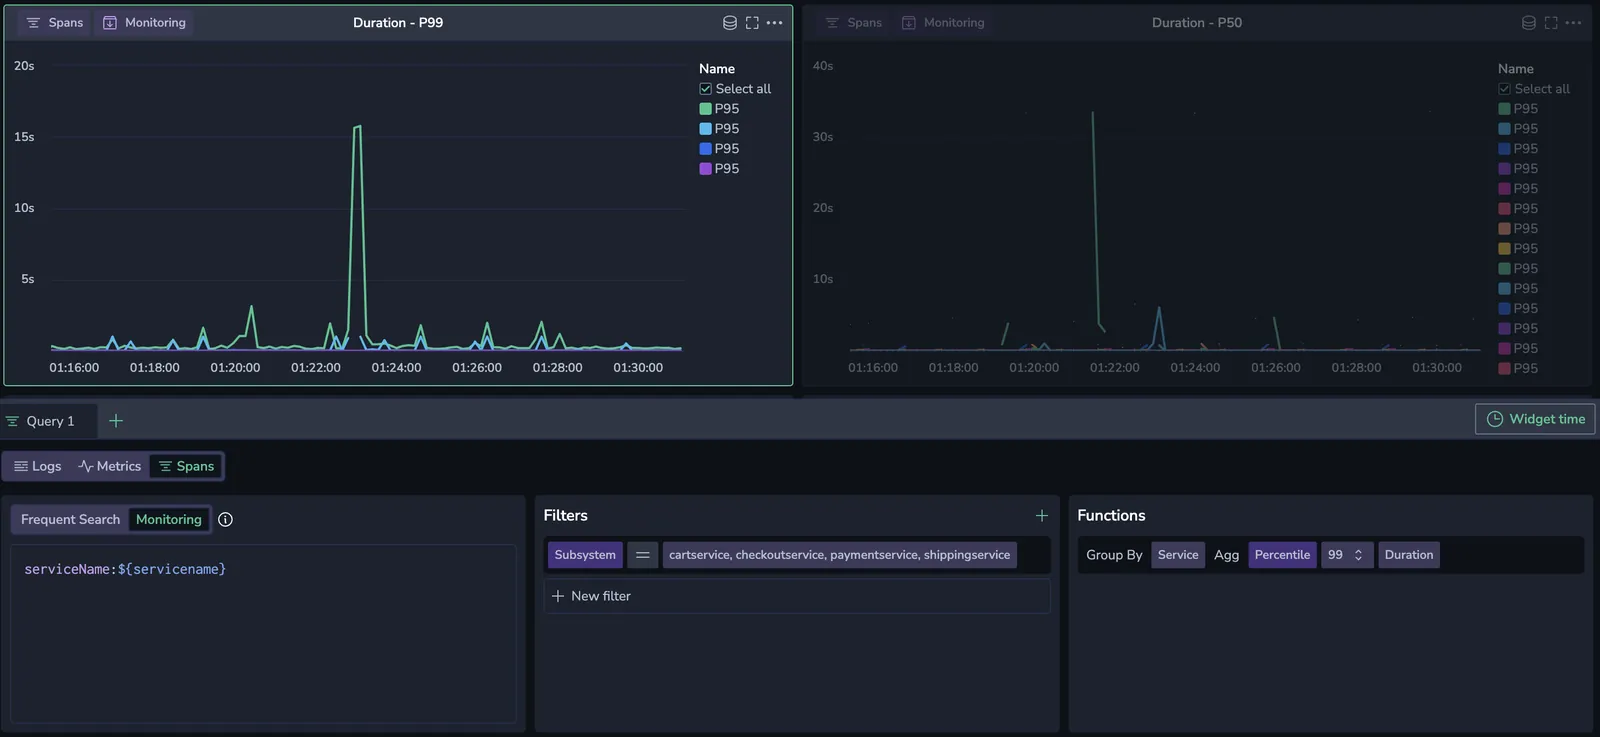
The spans-based Query Builder allows you to create complex queries by crafting Lucene-based queries and then adding filters and functions.
Data source
In Builder mode, select spans as your source.
Data pipeline
Choose to query Frequent Search or Monitoring spans. Find out more about TCO pipelines for spans here.
Filters
To add a filter, click +. Choose a label and an associated value.
Select the = or != operator from the drop-down menu to include or exclude one or more values, respectively.
Selecting the =~ or !~ operators will allow you to input a regex expression.
To add additional label-value pairs, click the + button.
Functions
To add a function, click +. Show an aggregated value using one of the following functions.
| Function | Description |
|---|---|
| Count | The total number of data points within the selected time range. |
| Count Distinct | The number of unique data points within the selected time range. |
| Sum | The sum of all data points within the selected time range. |
| Min | The smallest value among the data points within the selected time range. |
| Max | The largest value among the data points within the selected time range. |
| Average | The average value of all data points within the selected time range. |
| Percentile XX | Represents the value below which XX% of the data points fall. For example, Percentile 95 is the value below which 95% of data points fall. |
With Group By, you may group query results by 1 or more fields. The same time bucketing applies here as in log-based queries.
DataPrime query
You may create a DataPrime query as the basis for your widget.

Data pipeline
Choose to query Frequent Search or Monitoring data. Find out more about TCO pipelines for logs here and for spans here.
DataPrime query assistance
Use the DataPrime Query Assistance to describe your query in natural language and the system will transform your input into a structured query.
Convert to DataPrime
When you create a logs-based or spans-based query, you have the option of converting it to DataPrime syntax language by clicking Convert to DataPrime in the upper right corner of the Builder.

When you do, the transformed query will appear under the DataPrime tab in the Builder.
Once you change data sources or convert your query to DataPrime, your original query parameters in the Builder will be lost. Saving your widget will preserve the most recent state of the widget.
Widget time
The dashboard's overall time picker sets the default timeframe for your query. To customize the timeframe for this widget alone, click Widget time and switch off the toggle to unlink it from the dashboard’s timeframe. You can then choose a standard or custom timeframe for this widget specifically.
Additional resources
Next steps
Learn how to create and manage variables for your dashboards.