Service Catalog
Service Catalog offers a centralized, data-rich resource for managing and optimizing your system's services. It provides a holistic view of service health, enabling precise decision-making and faster issue resolution, ultimately improving the performance and reliability of your entire system.
Overview
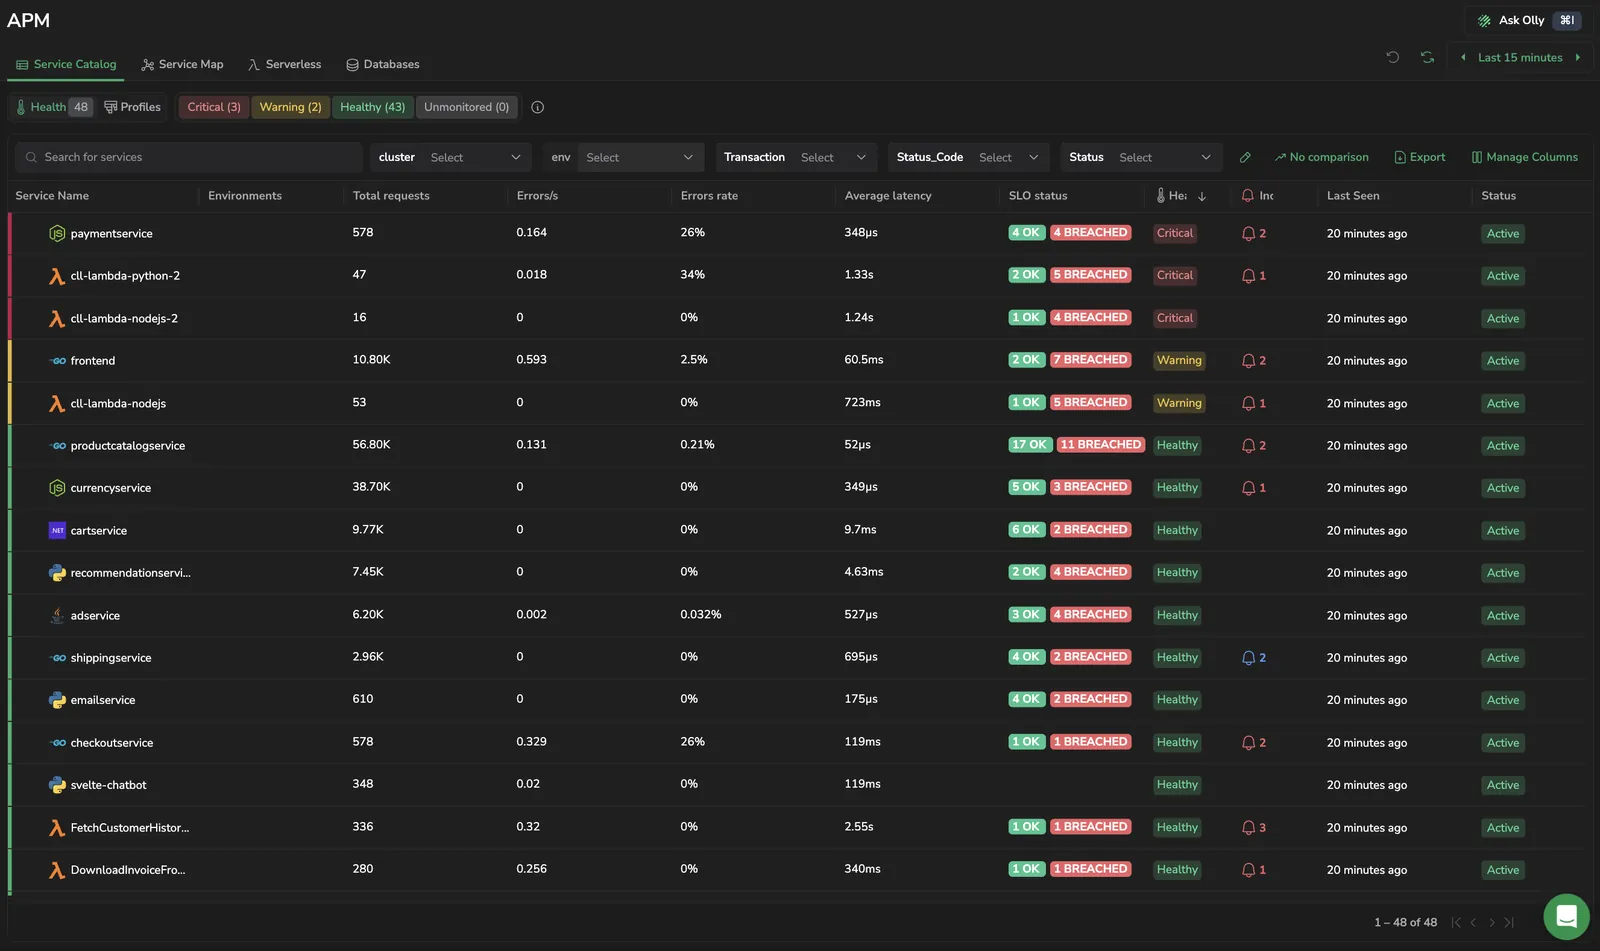
Service Catalog provides a complete list of services you have in your system, displaying the health status of each service. For each service, the catalog shows request volume, error rate, average latency, deployment environments, last seen, and activity status.
Use the search bar, search by service, or any other parameter.
Select the timeframe for which you want to view your services.
Use the environment filter to scope the catalog to a specific deployment environment.
Toggle between the Health view and Profiles view to identify service health and gain profiling insights.
Catalog columns
Every service in the catalog is summarized across the following columns. All RED metrics (requests, errors, latency) are computed from server and consumer spans only — client, producer, and internal spans are excluded.
Use the column picker in the catalog toolbar to add or remove columns. The Last seen column and the per-second columns are opt-in.
| Column | What it shows | Sortable | Default |
|---|---|---|---|
| Service Name | Service name. Select a row to open the service drilldown. Your catalog Environment filter selection carries over, intersected with the service's available environments. | Yes | Yes |
| Environments | The deployment environments this service is actively reporting spans in. The cell shows one environment as a chip plus a +N overflow indicator when the service reports in multiple environments. To see individual last seen times per environment, use the per-service chevron expansion described below. The drilldown's Environment filter is scoped to this list. | No | Yes |
| Total requests | Total number of incoming requests counted from server and consumer spans only. | Yes | Yes |
| Requests/s | Incoming requests per second — total incoming requests over the selected time range divided by that range in seconds. | Yes | No |
| Outgoing calls/s | Outgoing calls per second, taken from client and producer spans. | Yes | No |
| Internal operations/s | Internal operations per second, taken from internal spans. | Yes | No |
| Errors/s | Service-side errors per second — total errors over the selected time range divided by that range in seconds. | Yes | Yes |
| Internal errors/s | Internal-operation errors per second. | Yes | No |
| Outgoing errors/s | Failed external requests per second. | Yes | No |
| Errors rate | Error rate counted from server and consumer spans only. | Yes | Yes |
| Average latency | Average latency counted from server and consumer spans only. | Yes | Yes |
| SLO status | Aggregated SLO status for the service: Healthy, Warning, or Critical. Color-coded by severity. | Yes | Yes |
| Health | Service health status from your active health policy: Healthy, Warning, or Critical. The parent row shows the aggregated status across all environments; each row in the expanded environment breakdown shows the health status evaluated for that environment individually. | Yes | Yes |
| Incidents | Number of currently triggered incidents associated with the service. Select the count to open the incidents view filtered to this service. | Yes | Yes |
| Last seen | The most recent time the service reported any span, taken from the latest environment's last seen. Services with last seen older than the retention period are hidden. | Yes | No |
| Status | Activity status, populated for every service in the catalog. Active when the last seen falls within the selected time range; Inactive when it is outside that range. When a service is inactive, hover the Inactive badge to see how long ago it was last seen. Sorting on Status produces the same order as sorting on Last seen. Services inactive beyond the retention period are hidden automatically. | Yes | Yes |
Select the chevron next to a service to expand a grouped view of its environments. Each row in the expansion shows a single environment with its own Health status and last seen time, filtered by the same retention period as the parent row. Selecting an environment row opens the service drilldown with only that environment pre-selected in the drilldown's Environment filter.
Per-second columns and Events2Metrics
Per-second columns and per-second widget options (Requests/s, Errors/s, Outgoing calls/s, Internal operations/s, Internal errors/s, Outgoing errors/s) require Span Metrics as the APM source. They are hidden for accounts sourced from Events2Metrics. Hover the help icon next to each per-second column header to see the metric name in full.
Retention period
The default retention period is 30 days — services with no incoming metrics within that window are hidden from the catalog. The retention period is configurable via the Service Retention gRPC API. If metrics arrive for a previously hidden service, it reappears in the catalog and its historical metrics become available again.
Prerequisites
Coralogix Application Performance Monitoring (APM) installed and configured.
Access Service Catalog
In your Coralogix toolbar, navigate to APM. Select the Service Catalog tab.
Select the timeframe for which you want to view information.
Select a service to view the service drilldown.
Filter services using the environment filter
The environment filter provides a global way to scope the Service Catalog by deployment environment (for example, dev, staging, or prod). When configured, it appears as a filter above the service list and persists across all APM views, including drilldowns.
Use the environment filter to:
- Focus on a specific environment during triage without noise from other environments.
- Compare service behavior between staging and production during rollouts.
- Attribute error hotspots or heavy endpoints to a particular environment.
The environment filter requires the deployment.environment.name OpenTelemetry resource attribute to be set in your collector configuration. For setup instructions, see Environment filter.
Service drilldown
The Service drilldown displays more detailed information about the specific service selected.
The drilldown view displays the specific service you’re examining, along with all the information shown on the main service catalog page. It also provides visualizations and additional context that update dynamically based on the tab you’re viewing.
The service drilldown includes the following tabs:
Filter the drilldown using dimensions
Custom dimensions are span-tag filters that scope every tab of the service drilldown — Overview, Transactions, Operations, and so on. A dimension adds a label to a span metric — for example, cluster, region, or service.version — so the drilldown's charts and tables can be sliced by the values of that tag. Dimensions persist across time-range changes and across all drilldown tabs.
The dimensions bar sits above the drilldown tabs. When no dimensions are configured, it shows a Dimensions button; once you save one or more, each appears as a filter chip you can select to narrow the view.
Note
Dimensions are configured and applied inside the service drilldown. The main Service Catalog list is filtered only by the environment filter.
Open a service drilldown from the Service Catalog.
Above the drilldown tabs, select Dimensions (or the pencil icon if dimensions already exist) to open the dimensions dialog.
Enter a Filter name, then select a Tag from the dropdown to bind the dimension to a span tag.
To add another dimension, select Add Dimension and repeat the previous step.
Select Save. Coralogix creates metrics for the dimension — this can take a few minutes to appear.
Once one or more dimensions exist, the dimensions bar shows each as a filter chip. Select a chip to filter the drilldown to a specific value of that dimension.
Limitations
Dimensions create metrics from spans and count toward your quota. Use a maximum of 5 dimensions, each with up to 10k cardinality.
Only users with the
SERVICE-CATALOG:UPDATEDIMENSIONSCONFIGpermission can create or edit dimensions. Users without the permission see Show Dimensions as a read-only view.
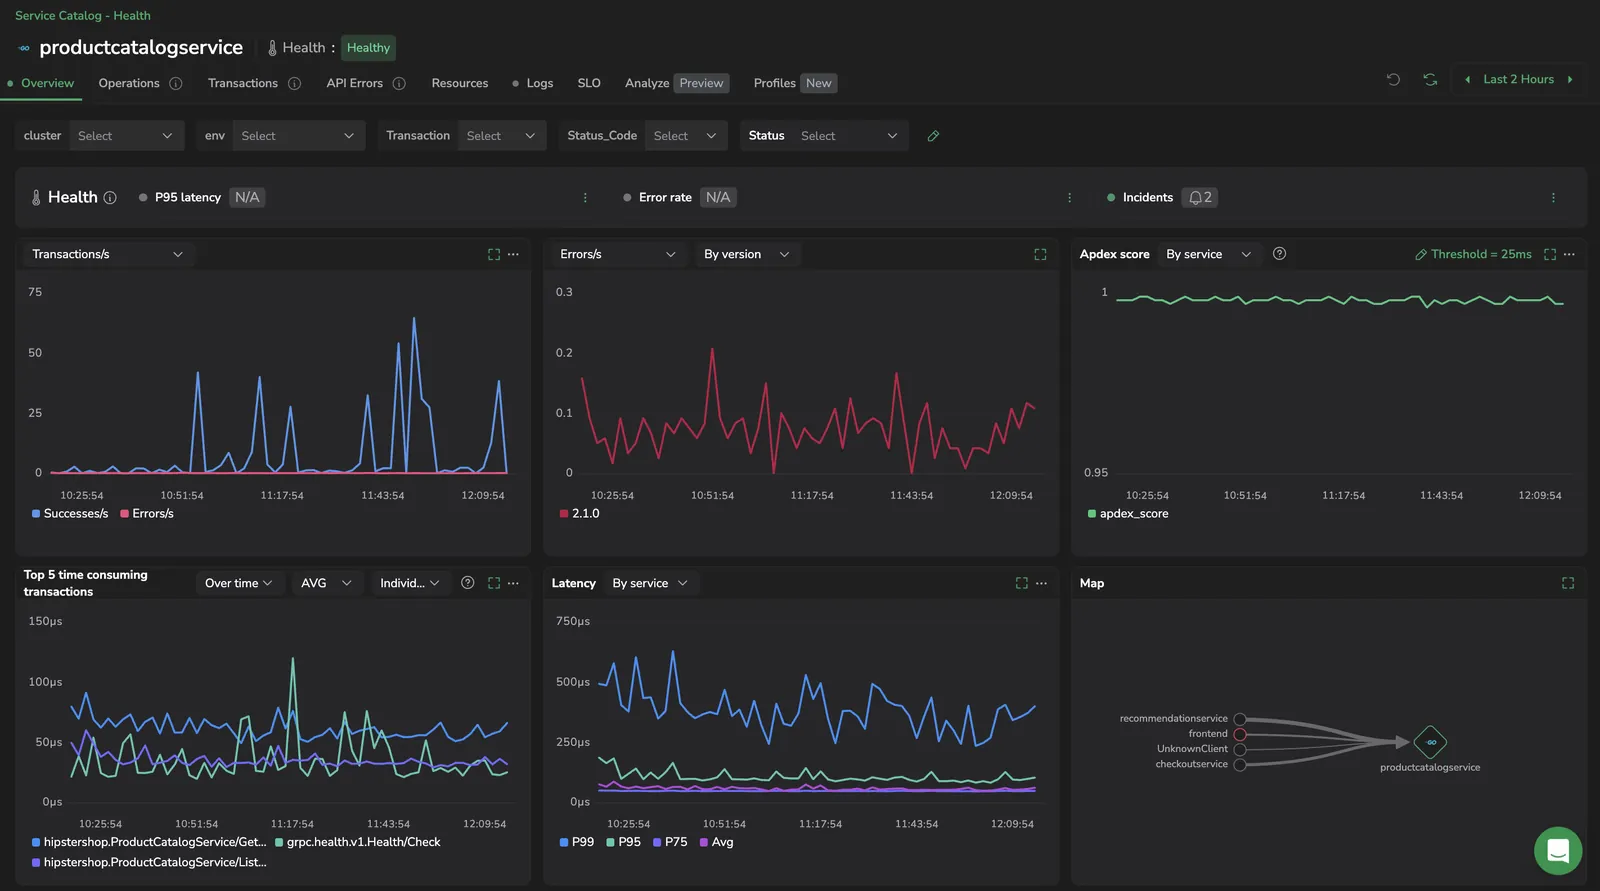
Overview
The Overview tab gives a summary of the service.
Overview widgets
The widgets in this tab give you a broad overview of the service for the timeframe selected in the top bar. The Overview widgets include:
SLO: An overview of the current SLOs, how many are okay, how many are breached, and how many are not available.
Incidents: Displays triggered alert events within the service.
Average latency: Shows the average latency for the current service.
Requests per minute: Shows average requests per minute for the selected time frame.
Error rate: Displays the percentage of errors in relation to the total number of requests.
Transactions: Charts request throughput over the selected timeframe. Use the widget dropdown to switch the metric:
- Transactions/s (default): request rate per second, plotted as a line chart. Hidden when APM is sourced from Events2Metrics — the widget opens on Requests instead.
- Requests: absolute counts of successes and errors, stacked.
- Transactions per version: one line per service version (visible when grouping by service version is on).
Errors: Charts service errors over the selected timeframe. Use the widget dropdown to switch the metric:
- Errors/s (default): error rate per second. Hidden when APM is sourced from Events2Metrics — the widget opens on Errors instead.
- Errors: absolute error counts in the top five transactions or versions.
- Errors percentage: errors as a share of total requests.
Apdex score: Displays the Apdex (Application Performance Index) score over the selected timeframe. The Apdex score is a standardized metric used to measure and quantify user satisfaction with the response time of software applications.
Top 5 time consuming transactions: Shows the five transactions with the highest consumption. Use the widget dropdown to switch between two modes:
Over time: Plots each transaction's consumption across the selected timeframe. A second dropdown sets the visualization:
- Individual (default): One line per transaction.
- Stacked: An area chart with the five transactions summed at each point.
Your Individual/Stacked choice is preserved across reloads in the page URL and in your browser's local storage.
Total: Aggregates each transaction's total consumption across the timeframe.
Latency: Shows a graph with the service’s P99, P75, P50, and average latency. The latency widget supports two viewing modes:
- Default (by service or by version): Displays all percentiles (P99, P75, P50) and average latency on a single chart for the selected timeframe.
- Historical: Compares a single selected quantile across three time offsets — Current, 1d before, and 7d before — to identify latency trends and regressions. Select Historical from the widget dropdown, then choose the quantile to compare (P50, P75, P95, P99, P99.99, P99.99999, or Avg).
Note
Latency percentiles are calculated using the
histogram_quantile()function, which is commonly utilized in systems like Prometheus to compute quantiles (e.g., the 95th percentile) from histogram data. In Coralogix APM, with Event2Metrics, a predefined set of buckets (all in microseconds) is used for this calculation. These buckets include: 1, 2.5, 5, 7.5, 10, 25, 50, 75, 100, 250, 500, 750, 1000, 2500, 5000, 7500, 10,000, 25,000, 50,000, 75,000, 100,000, 250,000, 500,000, 750,000, 1,000,000, 2,500,000, 5,000,000, 7,500,000, and 10,000,000.Map: Shows a mini version of the service map.
The Map widget displays the service map centered on a selected service:
- Services that send requests to the selected service are shown on the left.
- Services that receive requests from the select service are displayed on the right.
Latency between services is shown on the connecting lines, with line thickness indicating severity—the thicker the line, the higher the latency. If multiple services have an error rate above 0%, the one with the highest error rate is highlighted with a red outline. Hovering over a service displays a tooltip showing its throughput, error rate, and average duration relative to the central service. Selecting a service opens a context menu with options to view the Service Overview, its errors, traces, or related logs.
Note
The Map view adjusts to screen size. On large screens, each service shows its throughput, error rate, and SLO status beside the service name (all relative to the central service except SLO status, which is per-service). On smaller screens, only the service name appears, and additional details are moved into a tooltip.
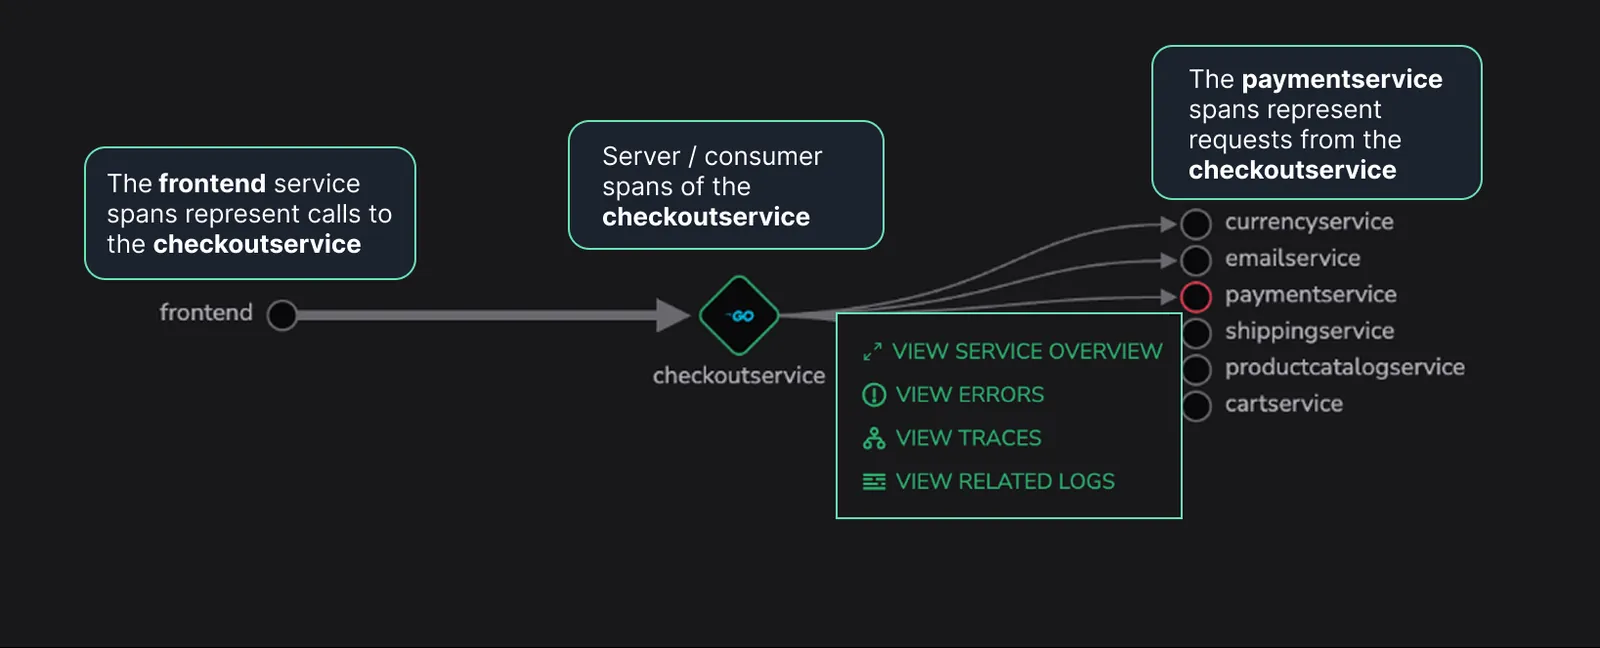
Viewing traces from the Map
Selecting a service in the Map and choosing View Traces retrieves spans based on the relationship between the selected service and the currently focused service.
Assume
checkoutserviceis currently in focus in APM. Selecting a dependency service and choosing View Traces from the action menu retrieves the relevant spans by querying archived data using Coralogix’s relational query capabilities.In practice, span selection follows the rules presented on the example below.
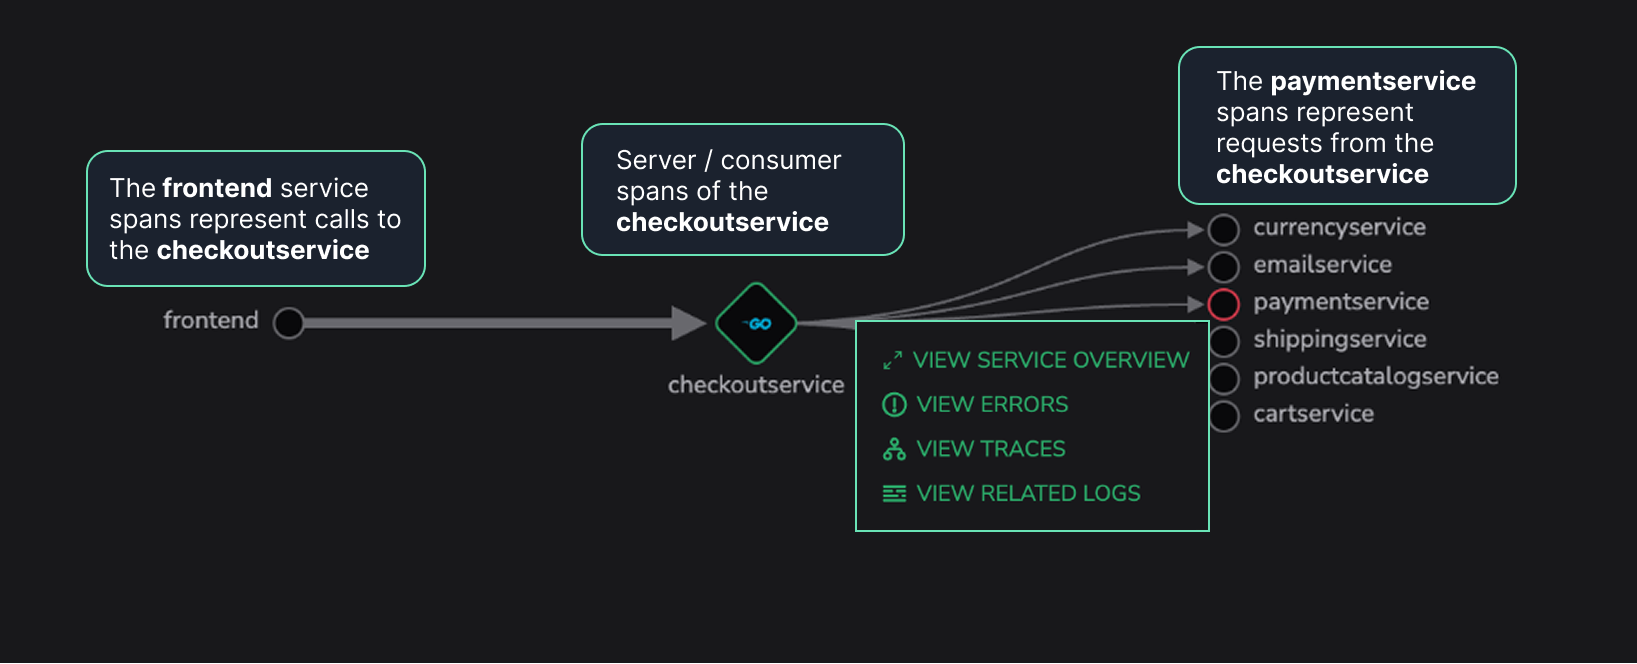
This approach enables consistent and accurate trace exploration directly from the dependency map, including historical context when available.
Manage widgets
To manage a widget, select the ellipsis. You can:
View Query to see the queries underlying it.
Create Alert to monitor service performance and notify you when there are changes.
Group metrics per service version
You can monitor your service health by displaying metrics for each version of your service. Use this data to track changes resulting from version updates or multiple service versions running in parallel. Visualize the changes in the Coralogix UI, and continue with further investigations, such as displaying related traces, etc. Version data is available for the Transactions, Errors, Apdex, and Latency widgets. For details, see the Group by Service Version documentation.
Transactions
The Transactions tab allows to rapidly investigate the radius of the impact of different services in your system over time.
Use it to:
Investigate the performance of each transaction by breaking it down into its constituent operations.
Gain a granular understanding of how each segment, a collection of related operations, affects the performance of the entire transaction over time.
Rapidly identify and troubleshoot the segments causing performance issues over time.
At the top of the tab, three charts summarize transaction activity:
- Throughput: request volume. Use the chart dropdown to switch between Requests/s (default) and Requests (absolute count). The Requests/s option is hidden when APM is sourced from Events2Metrics.
- Number of errors: error volume. Use the chart dropdown to switch between Errors/s (default) and Errors (absolute count). The Errors/s option is hidden when APM is sourced from Events2Metrics.
- Response time: response time across transactions, with a percentile selector (P50, P75, P90, P95, P99, P99.99, P99.99999, or Avg).
Each row in the transactions table shows total requests, total errors, error rate, latency percentiles, and time consumed. Add Requests/s and Errors/s from the column picker to see per-second rates alongside the totals. Both columns are hidden when APM is sourced from Events2Metrics.
Operations
The Operations tab presents incoming, outgoing, and internal requests for your service. Select which request type you would like to view in the dropdown menu in the upper right-hand corner.
At the top of the page, three charts summarize the service's operations:
- Response time: response time across operations, with a percentile selector (P50, P75, P90, P95, P99, P99.99, P99.99999, or Avg).
- Requests: request volume. Use the chart dropdown to switch between Requests/s (default) and Requests (absolute count). The Requests/s option is hidden when APM is sourced from Events2Metrics.
- Errors/s: error rate per second. Use the chart dropdown to switch between Errors/s (default) and Errors (absolute count). The Errors/s option is hidden when APM is sourced from Events2Metrics.
Add Requests/s to the Operations table from the column picker to see the per-second rate alongside the totals. The column is hidden when APM is sourced from Events2Metrics.
Incoming requests
View the service's requests–in the form of server and consumer spans.
For each operation, view the operation type, method, time consumed, percentage of errors caused by the operation, and the percentage of the operation that comprised the total number of operations. These are all shown for the timeframe and dimensions selected.
View a deeper drilldown of each operation by clicking on an operation row or a series.
The drilldown shows the time when the operation occurred, the operation type, the service for which the operation was taken, the duration of the operation, and how many errors it generated. It also shows the Throughput, Error Rate, and Latency graphs for that specific operation.
Outgoing requests
View operations that the service requested from other services, in the form of client and producer spans.
For each operation, you can view the operation type, method, P95 latency, percentage of total requests, percentage of errors caused by the operation, and the time consumed. These are all shown for the timeframe selected in the top bar.
You can see a deeper drilldown of each operation by clicking on an operation row.
Internal requests
View operations internal to the service with internal spans.
For each internal operation, you can view the operation type, method, P95 latency, percentage of total requests, percentage of errors caused by the operation, and the time consumed by the operation. These are all shown for the timeframe selected in the top bar.
You can see a deeper drilldown of each operation by clicking on an operation row.
Count restarts
Counter widgets in the service drilldown — Requests & Errors, Throughput, Errors, and Number of errors — count the first value each series reports after a process restart or a gap in metrics. That first value is the cumulative counter accumulated before the restart, so it can show as a spike even though no extra traffic happened. Clear the Count restarts checkbox when those spikes obscure the real shape of your traffic.
Note
This feature is available for early-access customers. To request access and confirm your organization meets the feature criteria, contact your account representative or Support.
To configure the toggle:
From the Service Catalog, select a service to open its drilldown.
In the drilldown header, select the gear icon. Its tooltip reads Count restarts.
In the popover, set the Count restarts checkbox:
Selected (default): the first value each series reports after a restart or gap is counted as real traffic.
Cleared: restart and gap resets are excluded from the count.
Your choice is remembered per service in your browser, so reopening the same drilldown later restores the setting you last picked. Changing the time range reloads the affected widgets without resetting the toggle.
Customize chart visualization
Each chart in the Operations and Transactions tabs has its own visualization controls. Select the icon in the chart header — its tooltip reads Graph configuration — to open the configuration overlay.
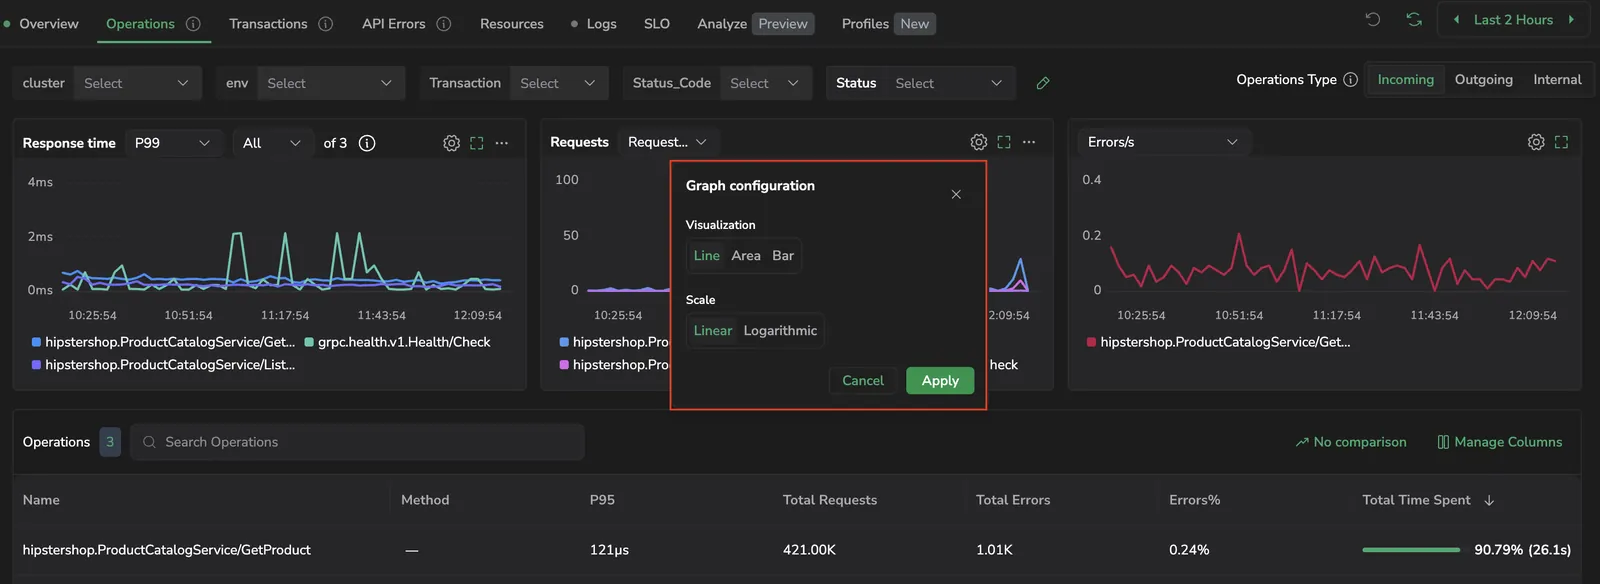
| Setting | Options | Default |
|---|---|---|
| Visualization | Line, Area, Bar | Line |
| Scale | Linear, Logarithmic | Linear |
Select Apply to commit the change for that chart, or Cancel to discard. Your selection persists per chart series in browser local storage, so switching services or refreshing the page preserves the layout you set.
Chart resolution
Coralogix picks the interval that drilldown charts use based on the selected time range. Shorter ranges get a finer interval so brief spikes stay visible. Longer ranges get a coarser interval so the chart remains readable.
| Time range | Interval |
|---|---|
| Up to 10 minutes | 15 seconds |
| 10 minutes to 1 hour | 1 minute |
| 1 to 4 hours | 2 minutes |
| 4 to 24 hours | 20 minutes |
| 1 to 2 days | 30 minutes |
| 2 to 7 days | 2 hours |
| More than 7 days | 12 hours |
The interval applies to every widget in the drilldown, including the Service Overview, Operations, Transactions, and Latency charts.
Dependencies
Dependencies allow to monitor and analyzes how your instrumented services interact with databases, external APIs, third-party libraries, and other microservices. By mapping these relationships, you gain actionable insights into how each dependency affects your application's performance.
API errors
API Error Tracking simplifies debugging of backend services by assembling thousands of similar API errors into a single group.
Resources
The Resources tab provides a unified, searchable inventory of the service’s Kubernetes and cloud resources, grouped by type by default. It reflects the layout and experience as the Infrastructure Explorer main view. You can view and filter infrastructure resources such as Deployments, Pods, Replica Sets, and Services in context, along with metadata like cloud, account, and environment. From here, select Go to Infrastructure Explorer to open the full infrastructure view for deeper analysis.
Logs
The Logs tab presents all related logs for the selected service. The following actions are enabled:
Open a new tab with the logs in your Coralogix Explore Screen by selecting Open Log Query.
Set up Correlation Mapping to allow your system to identify the fields in a log that are related to the service. The feature does this by mapping a single key to one or more replacement keys in the service’s logs.
Navigate to Setup Correlation on the right-hand side of the Logs tab.
Select the replacement logs key from the dropdown menu.
You can see a deeper drilldown of each operation by clicking on an operation row.
SLO
A Service Level Objective (SLO) is a measurable target that defines the acceptable performance or reliability of a service, ensuring it meets user expectations. By tracking key metrics such as error rates and latency against predefined thresholds, SLOs enable teams to maintain high service quality while optimizing resource usage.
The SLOs view in Coralogix UI offers a comprehensive overview of each SLO's status, target, and remaining error budget, displayed through visual indicators and detailed metrics. This enables teams to proactively address potential issues, prioritize engineering efforts, and ensure alignment between reliability and business objectives.
Whether for incident management, capacity planning, or enhancing user experience, SLOs are a crucial tool for optimizing service health and reliability in Coralogix APM.
Analyze (preview)
The Analyze tab provides an automated, trace-based dependency map for any instrumented service. It aggregates distributed traces to visualize how your service communicates with other services, databases, caches, and external endpoints — revealing request volumes, error rates, latency, and health status at a glance.
Profiles
Profiles allow to view and explore services even if they do not emit spans or metrics. Profiling data alone is enough to enable a service profile, ensuring that every service in your environment is visible and observable.
Service retention
Coralogix presents services in the Service Catalog based on their metrics. If we do not receive metrics for a service for 30 days, the service is removed from the Catalog. This practice ensures the Catalog remains current and uncluttered, simplifying user navigation and minimizing unnecessary resource usage. To adjust the 30-day retention period, use our Service Retention gRPC API. Should we receive metrics for a deprecated service after its removal, it will reappear in the Service Catalog and its historical metrics become available.
The same retention applies to the per-service Environments list: an environment is shown only if it has reported spans within the retention period.
Next steps
Set up Alert-based service health so the catalog reflects each service's real-time status.
Use Service Governance to attribute APM ingestion per service, spot services driving cost or cardinality, and act before any one service trips its per-service limit.