Configuring an alert definition
An alert definition is a rule that tells Coralogix what to monitor, when to fire, and how to notify. The alert creation wizard guides you through four steps in the order that mirrors how you actually think about an alert: define the signal first, decide what counts as a problem, select how to respond, and only then label and schedule it.
Why the wizard is shaped this way
Earlier versions of the form asked for a name, description, and labels before you had even chosen the data to monitor. The new wizard moves that metadata to the end of the flow because the most useful name, description, and labels are the ones written after you understand the full context of the alert. Each step builds on the previous one, and you can step back at any point without losing earlier choices.
Alert creation workflow
What you need
- Access to Coralogix with permission to create alerts
- At least one data source (logs, metrics, traces, or security data) ingesting
- A clear idea of the condition or pattern you want to monitor
- A Notification Center connector or routing label set up if you plan to send notifications outside Coralogix
Step 1: Query
The wizard opens on Query. Select the alert type that matches what you want to monitor, then describe the signal Coralogix should evaluate.
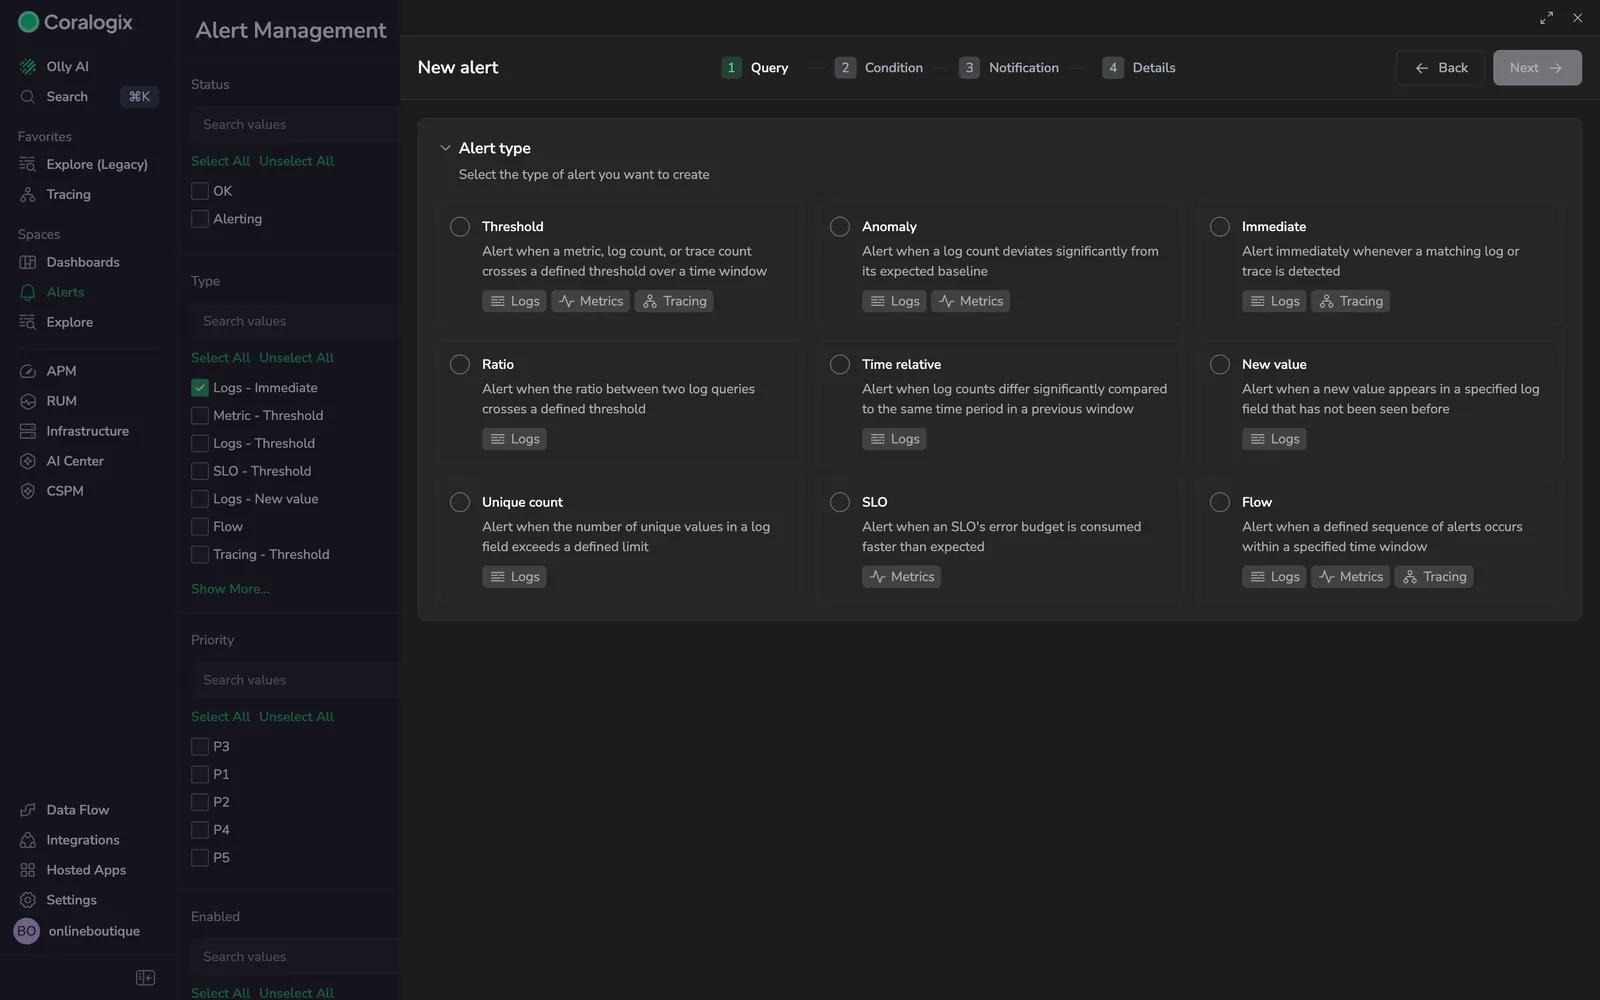
| Alert type | Use it when |
|---|---|
| Threshold | A metric, log count, or trace count crosses a fixed level over a time window |
| Anomaly | A log or metric count deviates significantly from its learned baseline |
| Immediate | You want a notification on every matching log or trace as soon as it arrives |
| Ratio | The ratio between two log queries crosses a defined threshold |
| Time relative | Current log counts differ significantly from the same window in a prior period |
| New value | A previously unseen value appears in a specified log field |
| Unique count | The number of unique values in a log field exceeds a limit |
| SLO | An SLO error budget is consumed faster than expected |
| Flow | A defined sequence of alerts occurs within a time window |
After selecting a type, define the signal:
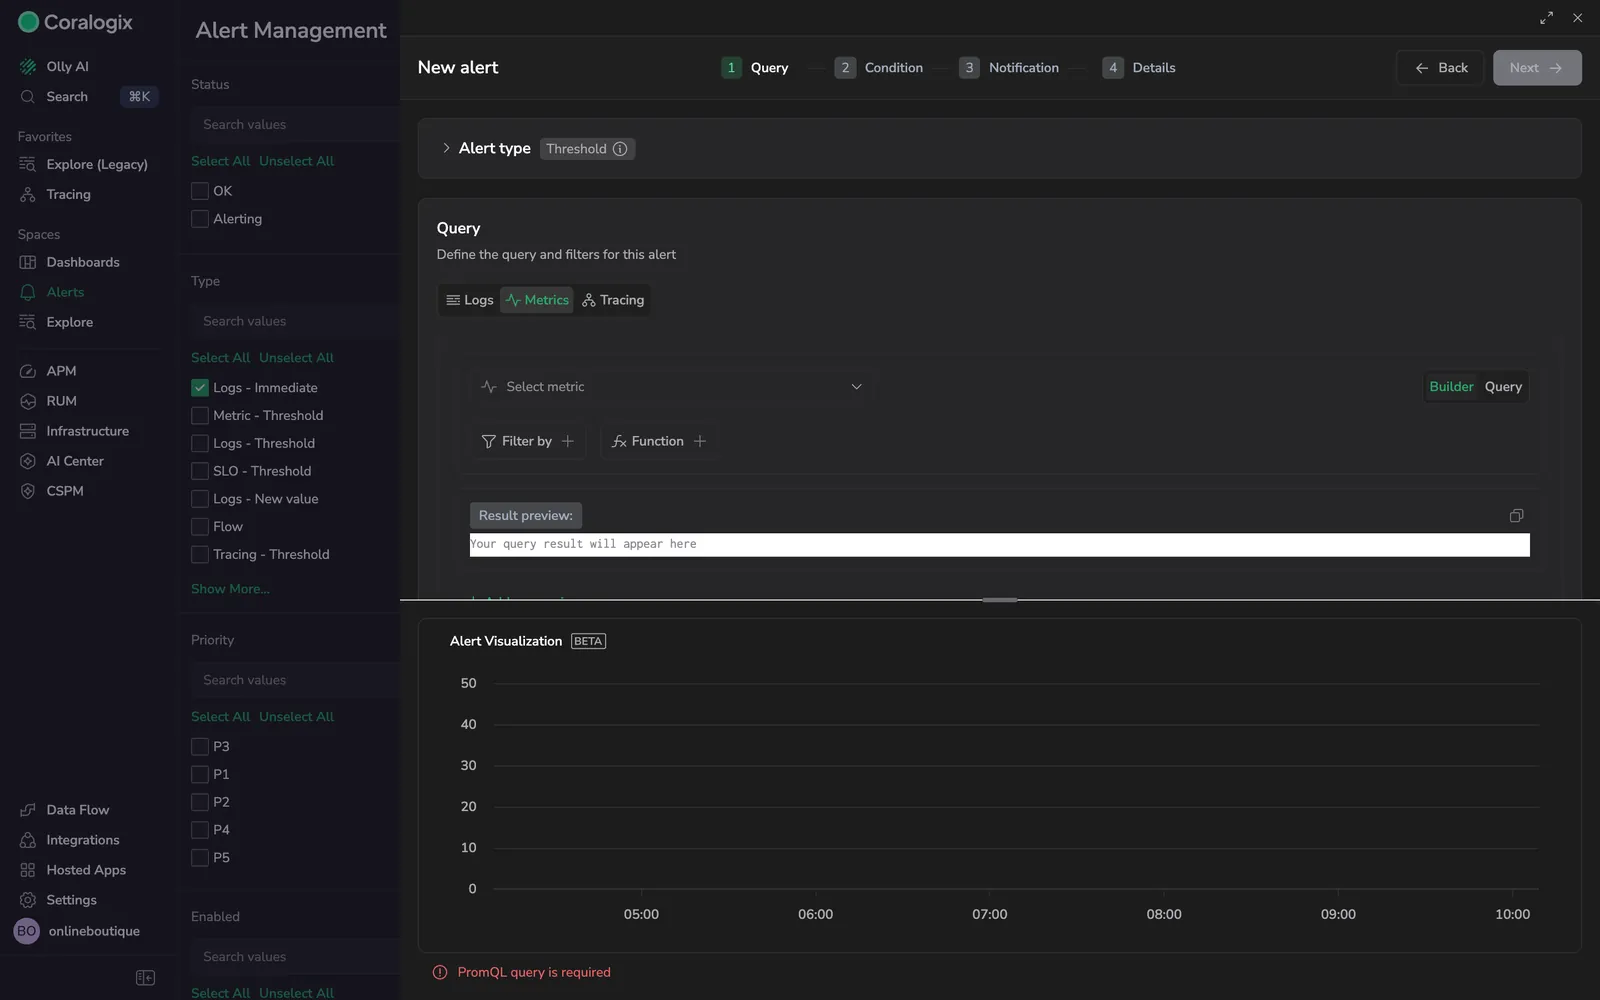
- Logs and traces: write a Lucene query and narrow it with filters such as application, subsystem, severity, or tag.
- Metrics: switch between Builder and Query to construct a PromQL expression, group by labels, and preview the result series.
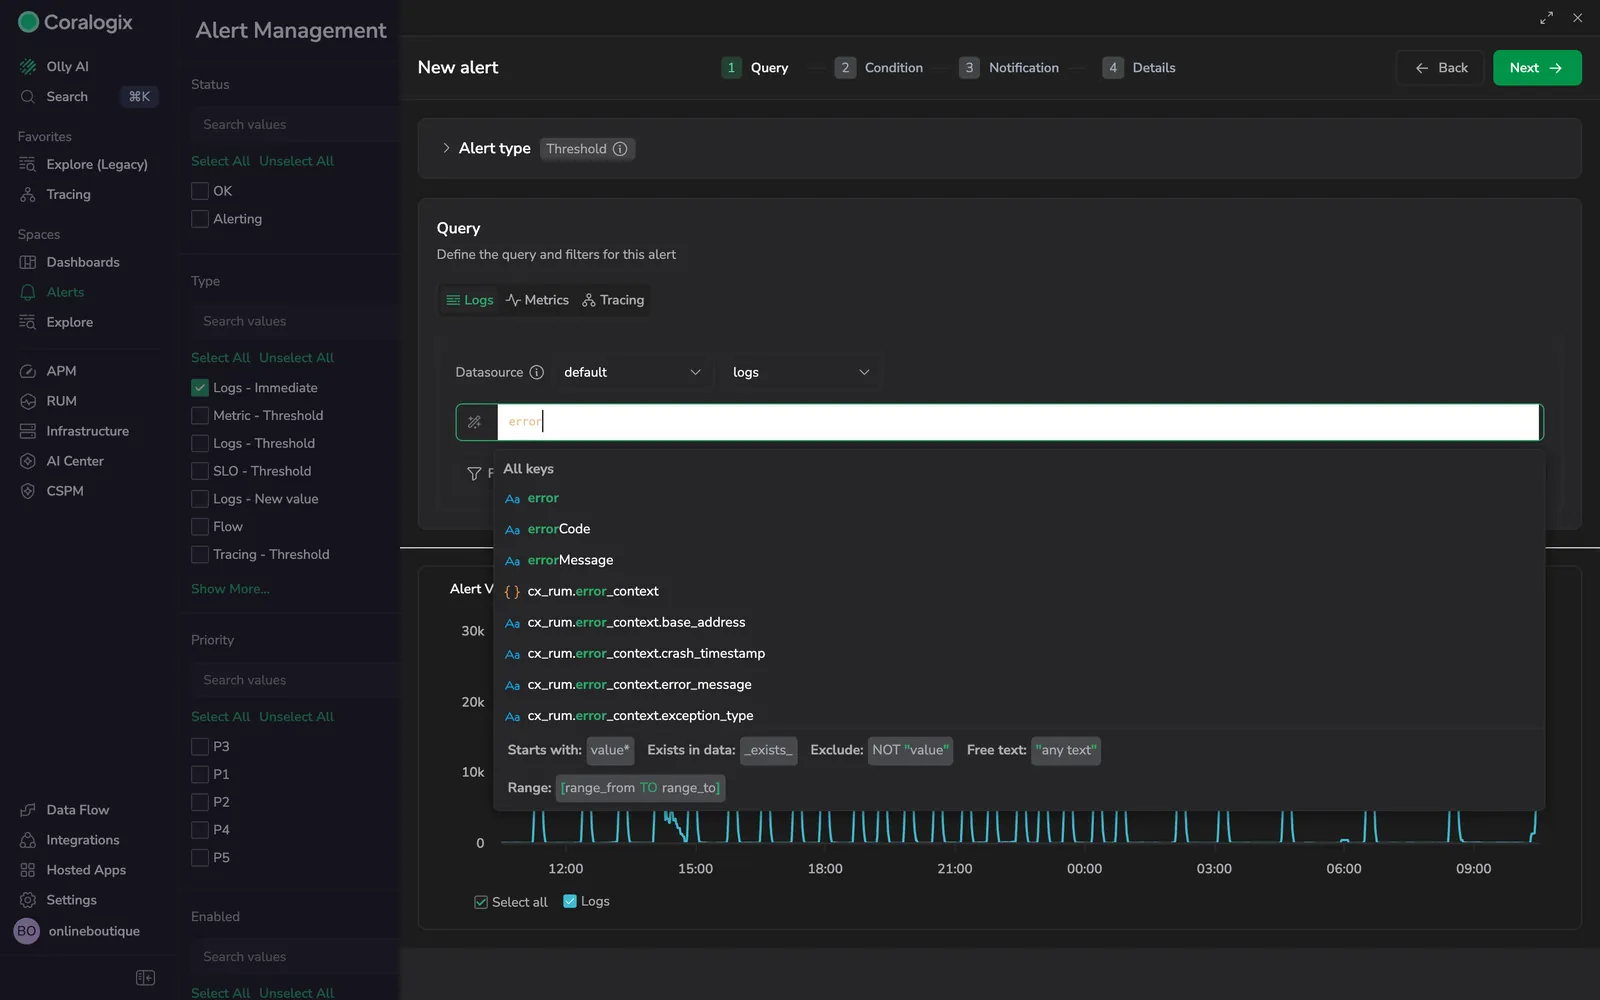
The Alert Visualization panel runs in the background as you build. It evaluates the full alert definition over the last 24 hours, highlights the time frames that would have triggered, and respects any duration requirement you set in Step 2. The preview is the fastest way to catch a query that is too noisy or too quiet before you ever save the alert.
Note
Preview results can differ from live evaluation due to metric ingestion delays, over-time aggregations, or complex expressions. When a query returns more than 20 series, the preview shows a sample of up to 20 permutations: narrow your grouping or add filters to evaluate a specific one.
Step 2: Condition
The Condition step turns the query into an actionable rule. You set the threshold logic, the priority, and what should happen when data is missing.
- Trigger logic: express the condition in plain terms, for example more than 100 in 5 minutes, at least once in 30 minutes, or for over 30 minutes. The duration choice matters: "at least once" highlights each crossing, while "for over" requires a continuous breach.
- Priority: assign P1 through P5. Priority drives routing decisions later in the Notification step.
- Group by: count and evaluate separately for each combination of label values. Only events that contain all selected fields are considered.
- Missing data behavior: pick the state the alert holds when the source returns no data: Set OK, Set Alerting, or hold its previous state. Add Auto retire to clear stale alerts after a defined period.
- Advanced configurations: delay evaluation by a fixed number of seconds to absorb late-arriving data. See Custom evaluation delay for when this matters.
You can add multiple conditions to the same alert when you need tiered severity from a single query. See Multiple alert conditions.
Step 3: Notification
The Notification step is where you decide what an alert is for. Coralogix encourages you to think of notifications in terms of operational outcomes (opening a Case that someone owns and resolves) rather than raw webhook fan-out.
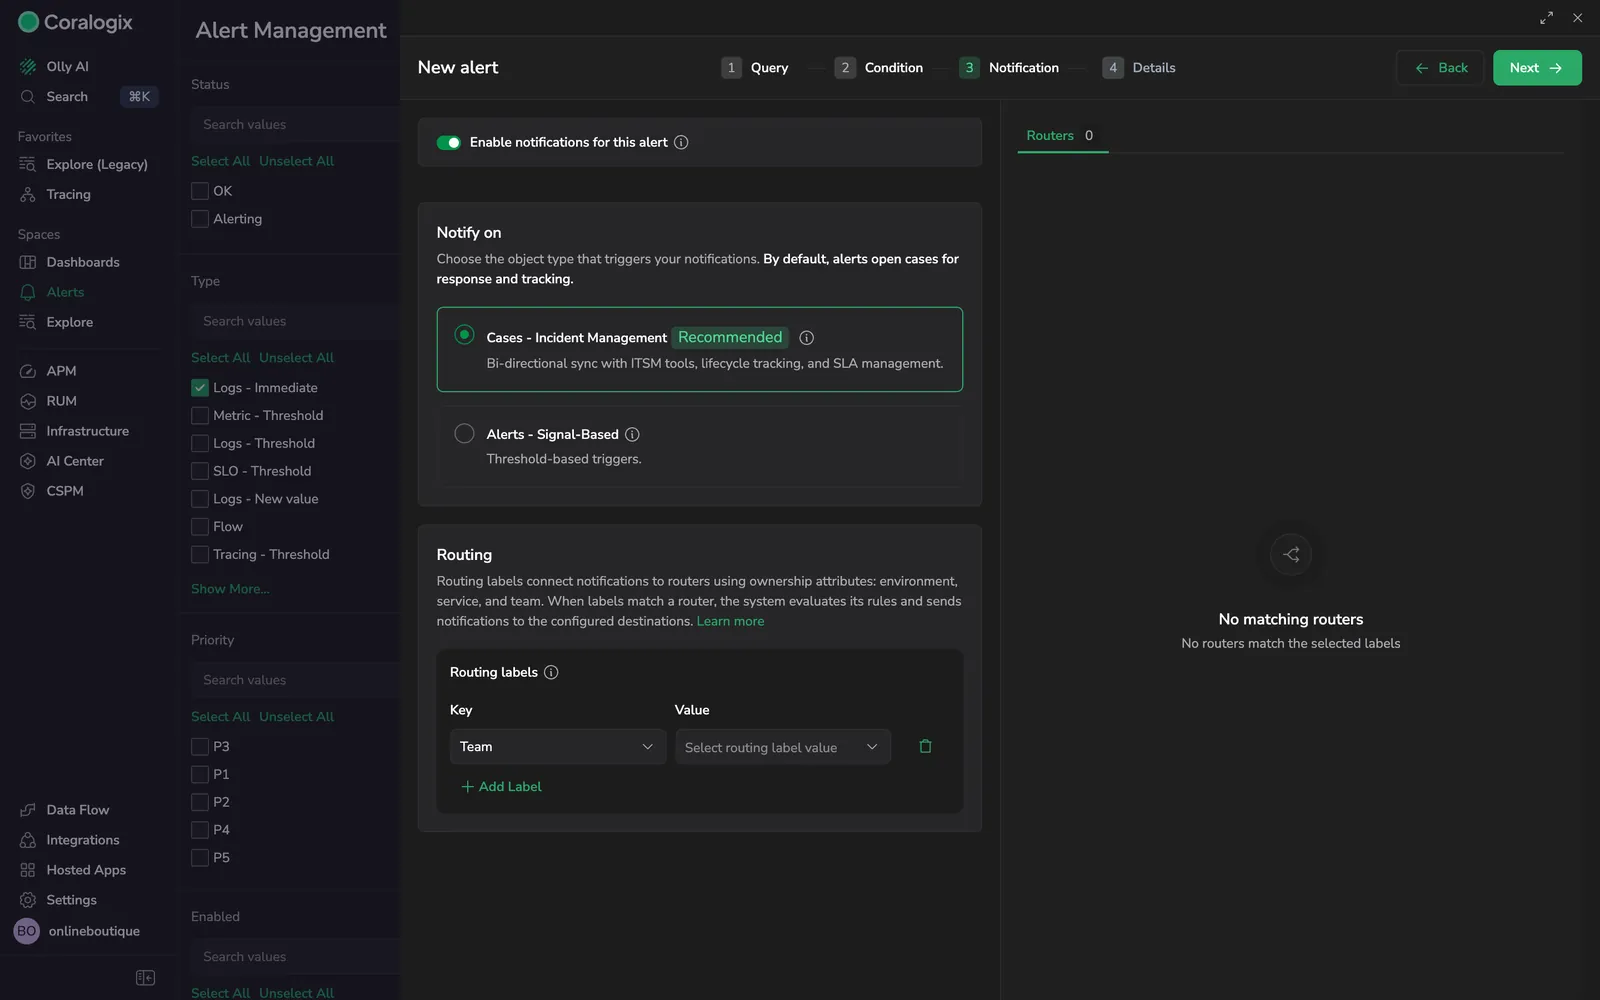
Pick what triggers the notification
- Cases, Incident Management (recommended): opens a Case when the alert fires. Cases unify related alerts into one operational incident with bi-directional ITSM sync, lifecycle tracking, ownership, and SLA management. Most teams should start here.
- Alerts, Signal-Based: sends a per-alert notification. Use this when you want a thin, fire-and-forget signal, for example broadcasting to a chat channel, paging on threshold or forecast triggers, or driving custom webhooks. Legacy outbound webhooks live inside this option as Custom notifications.
Route the notification
Coralogix matches notifications to routers by routing label, not by hard-coded destinations. Add one or more routing labels (typically Team, service, or environment) and the system finds the router whose ownership rules match and delivers to its configured connectors and presets. A single alert can then fan out to different destinations as ownership changes, without ever editing the alert.
If no router matches the labels you select, the wizard shows No matching routers in the side panel. See Routing rules for how to author one.
Tune cadence
- Notify every: how often a re-fire notification is sent while the condition stays true, for example every 10 minutes.
- Notify when resolved: turn on a follow-up notification when the condition clears. Resolution is automatic on the next evaluation cycle; resolving manually from the Incidents screen does not emit a notification.
Note
Terraform and API users: verify the notifyOn field. Setting it to triggered_only suppresses resolved notifications even if the toggle appears on in the UI. See Troubleshoot alerting.
Step 4: Details
By the time you reach Details, you know exactly what this alert watches and how it routes. That is the right moment to name it.
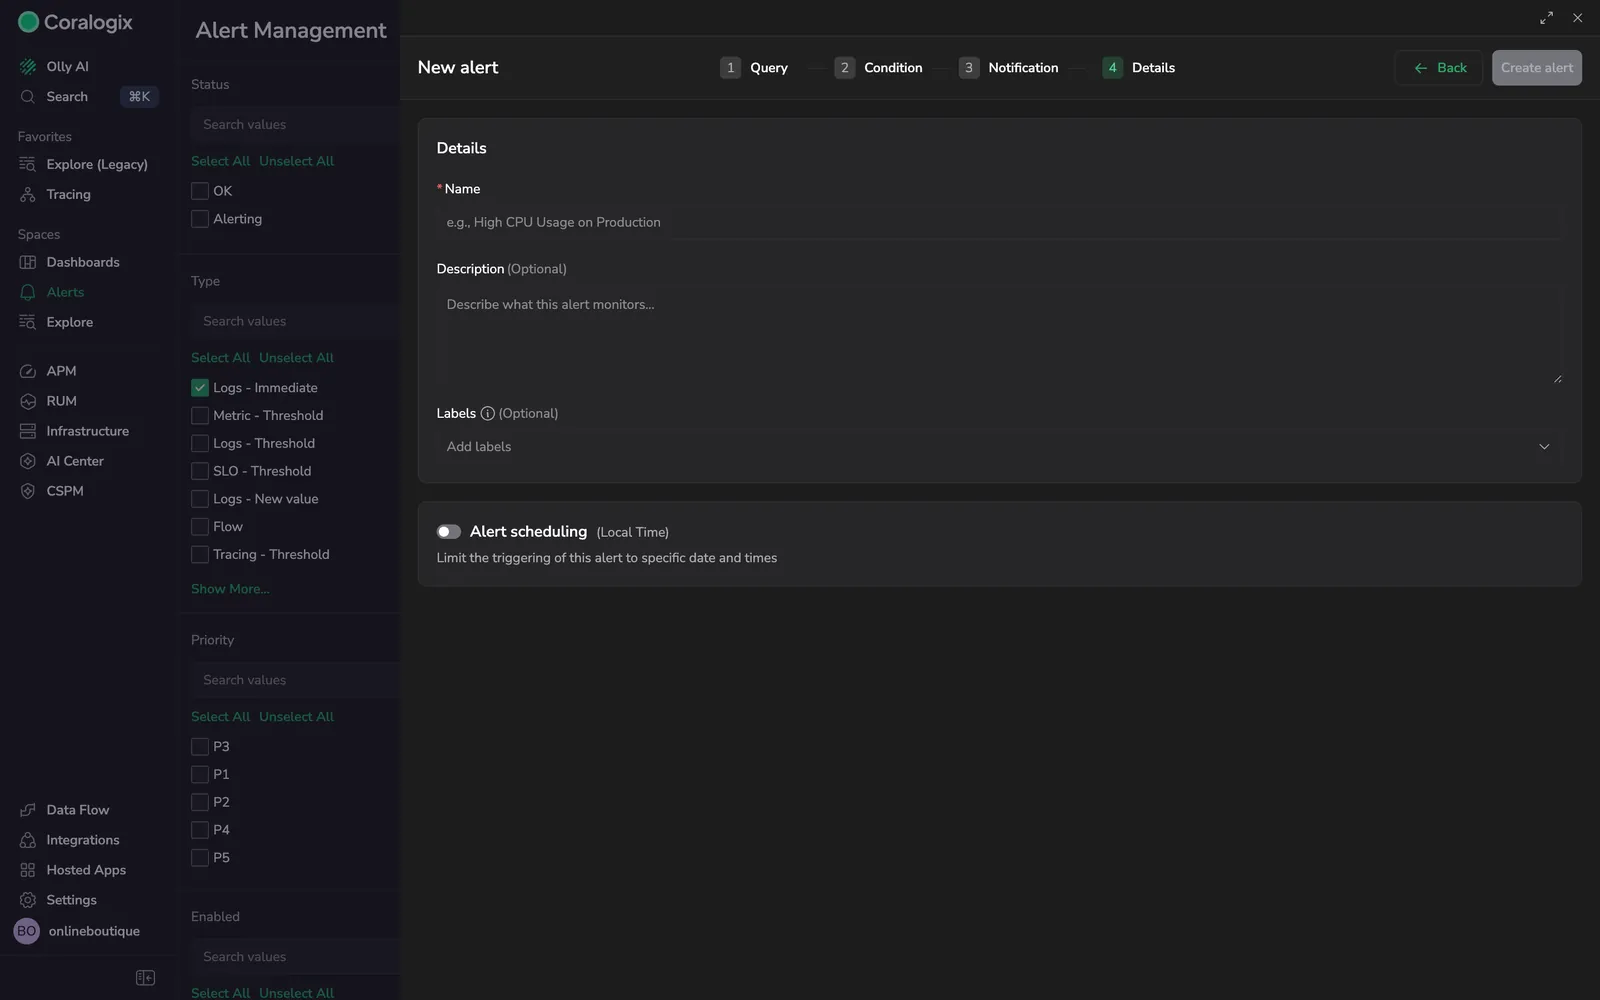
- Name: write the name your responders will read under pressure. "High CPU on production payment-service" beats "CPU alert".
- Description (optional): capture the reasoning behind the alert: what it detects, links to runbooks, and what the on-call should do first.
- Labels (optional): add key:value pairs that downstream tooling filters on. Labels also classify alerts in the Incidents view. APM alerts use
product:apm-service-catalogorproduct:apm-db-catalog; security alerts can usealert_type:securitycheckor the Set as security alert option. See Define alert details for the full label reference. - Case settings: when Group by is set in Step 2, decide whether matching combinations open a Combined case (one case aggregating all values that meet the condition) or Separate cases (one case per combination). Combined is best for fleet-wide symptoms; separate is best when each entity owns its own remediation.
- Alert scheduling (optional): restrict triggering to the days and hours when the alert makes sense, for example business hours only.
When everything is in place, select Create alert. The alert becomes active within 15 minutes.
Limitations
- New and edited alert definitions can take up to 15 minutes to become active.
- The number of Group by permutations is limited to 1000; only the first 1000 are tracked when more exist.
- If your metrics arrive with a delay (batch processing, cross-region replication), add a custom evaluation delay so the evaluator waits for data to settle.
Next steps
Learn how to configure metric-based queries in Metric-based query.
Having issues with your alert? See Troubleshoot alerting.