AI Center alerts and metrics
Deploy a prebuilt observability pack for AI applications. The AI Center Alerts extension installs two things together:
- Five Events2Metrics rules that convert AI spans into Prometheus-style metrics for latency, errors, cost, security issues, and quality issues.
- Five metric threshold alerts built on those metrics that fire on high error rates, slow responses, cost spikes, security violations, and quality issues.
Use the alerts out of the box, customize them, or query the metrics directly to build your own alerts and dashboards.
What you need
- AI spans flowing into Coralogix from one of the supported AI integrations. Span attributes follow the OpenTelemetry
gen_ai.*semantic conventions. - An existing application and subsystem in your account to scope the alerts. Each deployed alert is grouped by
application_nameandsubsystem.
Set up
Tip
From any AI Center page, select the bell icon in the page header to jump straight to the AI Center Alerts extension.
- In Coralogix, navigate to Integrations, then Extensions.
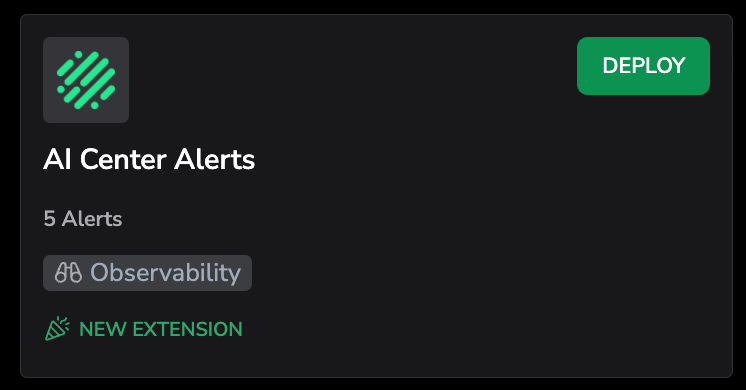
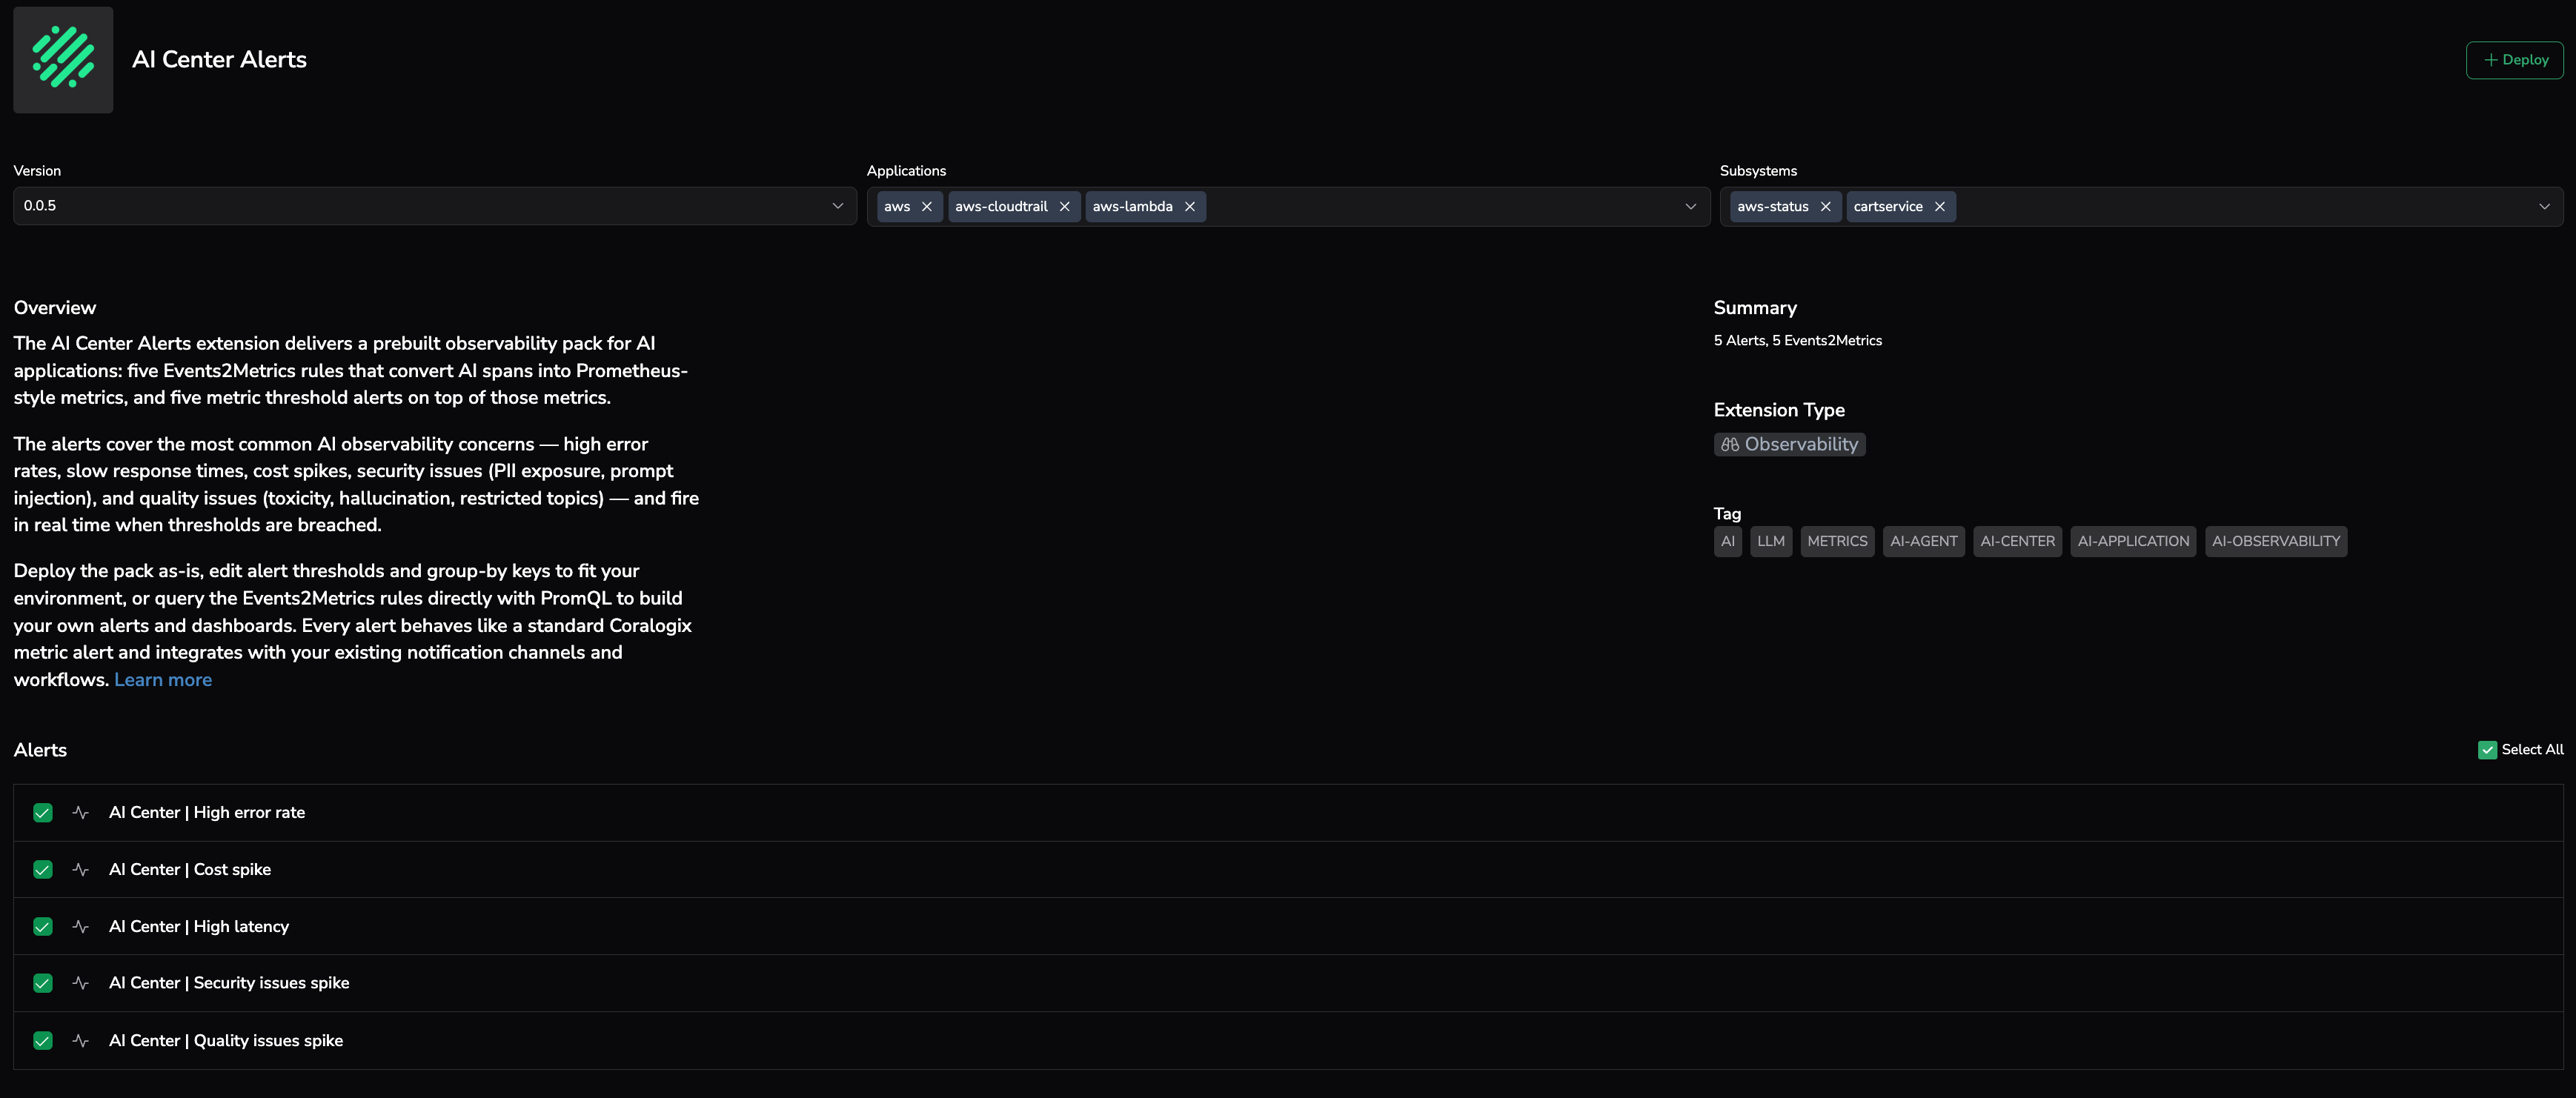
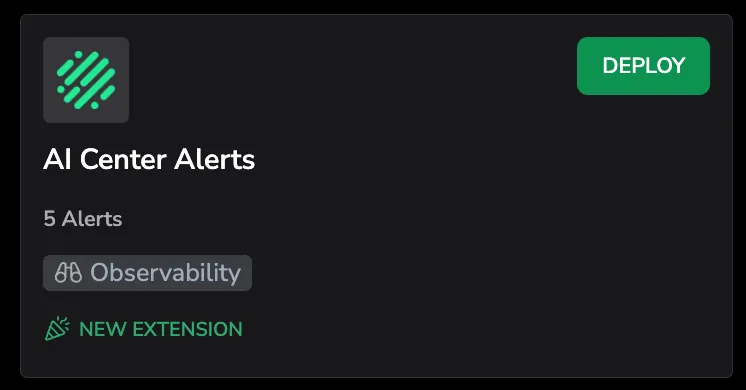
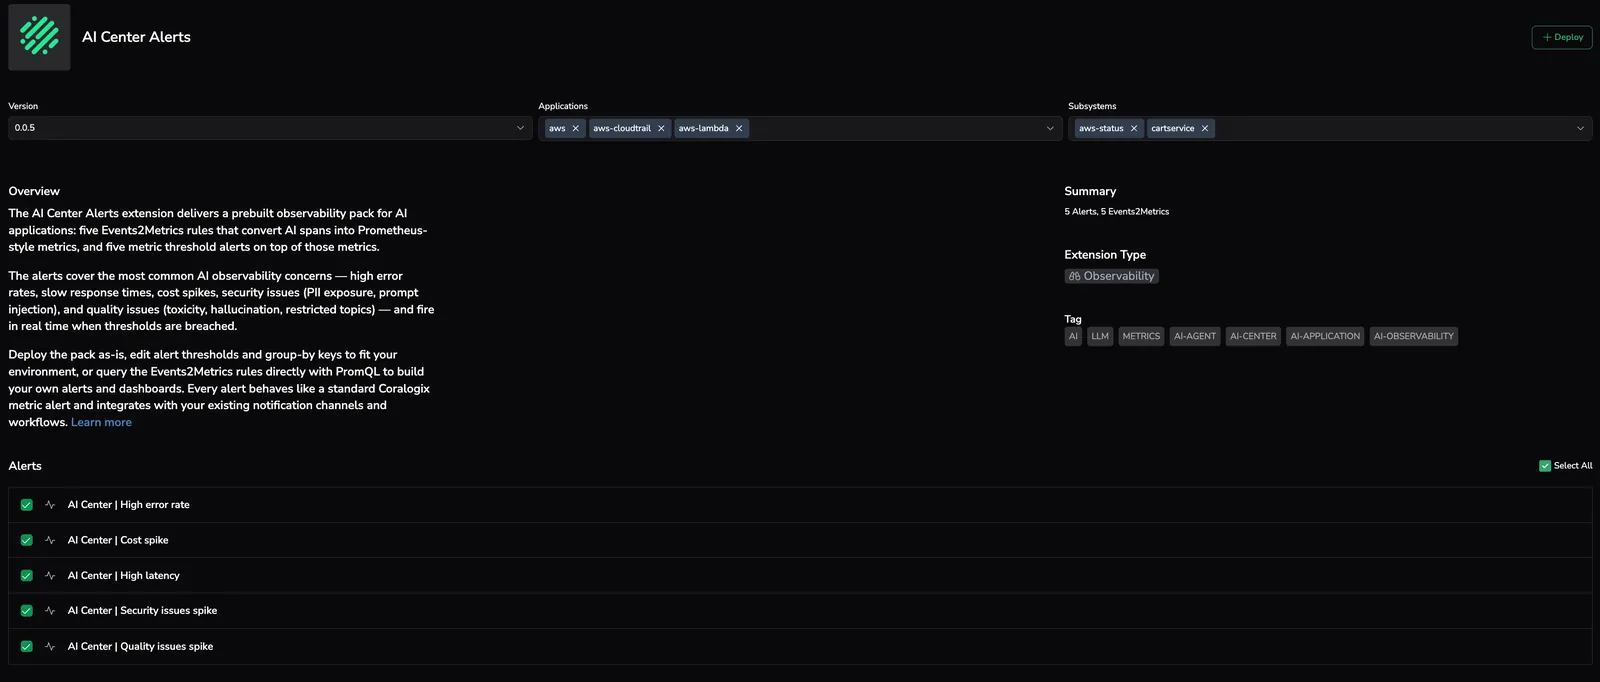
Find the AI Center Alerts card — search by name or filter by Observability — and select it to open the detail page.
From the Version dropdown, select the version you want to deploy.
- From the Application dropdown, select All.
- From the Subsystem dropdown, select All.
- Under Alerts, the five alerts are selected by default. Deselect any alert you do not want to deploy. The five underlying Events2Metrics rules are required for the alerts to function and are installed with the extension.
Select Deploy.
The extension creates the five alerts and the five Events2Metrics rules in your account.
- To view the alerts, navigate to Alerting, then Alert definition management. Alert names start with
AI Center |. - To view the Events2Metrics rules, navigate to Data Flow, then Events2Metrics. Names start with
ai_center_.
Use it
Customize an alert
After deployment, the alerts behave like any other metric threshold alert. You can edit thresholds, schedules, notifications, group-by keys, and priority.
- In Coralogix, navigate to Alerting, then Alert definition management.
- Find the alert you deployed. Alert names start with
AI Center |. - Select the alert to open it for editing.
- Adjust the threshold, time window, evaluation window, group-by keys, or notification settings.
- Save your changes.
Build custom alerts and dashboards on the AI Center metrics
The five prebuilt alerts group by application_name and subsystem. The underlying Events2Metrics rules also expose a user label and the full set of aggregations (cx_count, cx_max, cx_avg, cx_sum), so you can query them directly for custom alerts and Custom Dashboards.
Note
When writing PromQL against the AI Center metrics, use range functions like sum_over_time and avg_over_time. Do not use rate() or increase() — they are incompatible with Events2Metrics.
To build a per-user alert:
- Navigate to Alerting, then Create alert.
- Select Metric, then Threshold.
Enter a PromQL query against one of the AI Center metrics, grouped by
user. For example, count security issues per user over the last minute:Configure the threshold and notifications, then save.
Pick the sum_over_time window and the alert time window together
AI Center metrics are aggregated on a one-minute basis. When the alert evaluates, it looks at the most recent points within its time window — and each point already represents the sum_over_time window you set in the PromQL. Setting both to 5 minutes, for example, means the alert reads five overlapping 5-minute sums, so the practical window into source data is wider than 5 minutes. Pick the two windows together rather than independently.
To build a dashboard, create a metric widget in Custom Dashboards with a PromQL query against any of the ai_center_latency_cx_*, ai_center_error_cx_*, ai_center_prompt_price_cx_*, ai_center_response_price_cx_*, ai_center_security_issue_cx_*, or ai_center_quality_issue_cx_* metrics.
Update or remove the extension
When a new version of the extension is published, the Extensions page shows an UPDATE AVAILABLE indicator on the card.
To install the new version:
- Navigate to Integrations, then Extensions.
- Select the AI Center Alerts card.
- Select Update.
To uninstall the extension and its alerts and Events2Metrics rules, select Remove from the same page.
How it works
The extension installs two layers:
- Five Events2Metrics rules convert AI spans into Prometheus-style metrics, aggregated on a one-minute basis. See the Events2Metrics reference below for the rule names, source fields, and output metrics.
- Five metric threshold alerts evaluate those metrics with PromQL and fire when thresholds are breached. Because the alerts run on metrics rather than spans, they use the standard Coralogix alerting engine and integrate with your existing notification channels, schedules, and incident workflows.
Reference
Alerts
All five alerts are P1 metric threshold alerts. Each one is grouped by application_name and subsystem and notifies on triggered and resolved.
| Alert | What it detects | Default threshold | Time window |
|---|---|---|---|
AI Center | High error rate | Too many AI spans ending with errors | More than 5 errors per 5 minutes | 5 minutes |
AI Center | Cost spike | Total inference spend higher than expected | Combined tags.gen_ai.prompt_price and tags.gen_ai.response_price greater than 10 in the last hour | 60 minutes |
AI Center | High latency | AI span response time stays above target | Max latency greater than 60,000 milliseconds (1 minute) | 5 minutes |
AI Center | Security issues spike | Security issues firing too often | More than 10 issues per 10 minutes | 10 minutes |
AI Center | Quality issues spike | Quality issues firing too often | More than 10 issues per 10 minutes | 10 minutes |
Events2Metrics
Each rule applies a Lucene query against AI spans and extracts the source field listed below.
| Events2Metrics rule | Source field | Output metrics | Spans matched |
|---|---|---|---|
ai_center_latency_cx | duration | ai_center_latency_cx_count, ai_center_latency_cx_max, ai_center_latency_cx_avg, ai_center_latency_cx_sum | LLM calls sent via AI Center supported instrumentations |
ai_center_errors_cx | duration (counts matching spans) | ai_center_error_cx_count, ai_center_error_cx_max, ai_center_error_cx_avg, ai_center_error_cx_sum | Errored LLM calls sent via AI Center supported instrumentations |
ai_center_cost | tags.gen_ai.prompt_price, tags.gen_ai.response_price | ai_center_prompt_price_cx_count, ai_center_prompt_price_cx_max, ai_center_prompt_price_cx_avg, ai_center_prompt_price_cx_sum, ai_center_response_price_cx_count, ai_center_response_price_cx_max, ai_center_response_price_cx_avg, ai_center_response_price_cx_sum | LLM calls sent via AI Center supported instrumentations |
ai_center_security_issues_cx | duration (counts matching spans) | ai_center_security_issue_cx_count, ai_center_security_issue_cx_max, ai_center_security_issue_cx_avg, ai_center_security_issue_cx_sum | Spans with security guardrails or evaluations triggered, built-in or custom |
ai_center_quality_issues_cx | duration (counts matching spans) | ai_center_quality_issue_cx_count, ai_center_quality_issue_cx_max, ai_center_quality_issue_cx_avg, ai_center_quality_issue_cx_sum | Spans with quality guardrails or evaluations triggered, built-in or custom |
Every metric is labeled with application_name (from the span's applicationname), subsystem (from subsystemname), and user (from tags.gen_ai.request.user).
In addition to the metrics in the table, each Events2Metrics rule auto-creates a counter metric named <rule>_cx_docs_total that counts every span matching the rule's Lucene query. The pack therefore also produces ai_center_latency_cx_cx_docs_total, ai_center_errors_cx_cx_docs_total, ai_center_cost_cx_docs_total, ai_center_security_issues_cx_cx_docs_total, and ai_center_quality_issues_cx_cx_docs_total. None of the prebuilt alerts use these — they are available for custom alerts and dashboards (for example, total AI call volume or issue ratios).
Issue detection sources
The ai_center_security_issues_cx and ai_center_quality_issues_cx Events2Metrics rules count two types of triggered policies on AI spans:
- Built-in guardrails and evaluations labeled
p1. For the current set of built-in policies and their categories, see Prebuilt guardrail policies and Prebuilt evaluation policies. - Custom guardrails and evaluations at indexes 0 to 9 with category
securityorqualityandtriggered:"true".
All sources apply to both the prompt and response sides of a span.
Limitations
- More than 10 custom guardrails or 10 custom evaluations in the same category are not counted by the default issue alerts. To monitor additional ones, build a custom alert with an extended Lucene query.
- The high latency alert threshold is in milliseconds. The default value, 60000, equals 1 minute. To set a 30-second threshold, use 30000. To set a 5-minute threshold, use 300000.
- The cost spike alert reads price values from the
tags.gen_ai.prompt_priceandtags.gen_ai.response_pricespan attributes. - The five alerts default to grouping by
application_nameandsubsystem. To alert per user, build a custom alert against the Events2Metrics rules withuserin the group-by clause. - Each Events2Metrics rule in the extension is configured with a 30,000-permutation-per-day limit. High-cardinality combinations of
application_name,subsystem, andusercan reach this limit. Permutations beyond it are dropped, so alerts may miss issues from those slices. Track usage in Data Flow, then Events2Metrics. - The five Events2Metrics rules count against your organization's daily quota of 10M metric permutations. Metric rules are blocked when either the per-rule limit or the org-wide quota is reached.
- Metrics gather from the moment the extension is deployed. Alerts do not fire retroactively on AI spans ingested before deployment.
Troubleshoot
No alerts are firing. Cause: AI spans are not being captured, or no application or subsystem matches the deployment scope. Fix: confirm AI spans with tags.gen_ai.system are flowing in by querying _exists_:tags.gen_ai.system in Logs Explorer, then check that the alert's deployed applications and subsystems match your data.
A custom guardrail or evaluation is not counted. Cause: the custom item is at index 10 or higher, or the triggered field is not "true". Fix: move the item to indexes 0 to 9 and confirm the triggered field is set on a triggered span.
The latency alert never fires even with slow spans. Cause: the threshold value is in milliseconds. A value of 60 is 60 milliseconds, not 60 seconds. Fix: set the threshold in milliseconds. Common values: 30000 for 30 seconds, 60000 for 1 minute, 300000 for 5 minutes.