Metric usage analysis
The Metrics Usage Analyzer gives you a detailed view of your ingested metrics and labels. Use it to identify high-volume or high-cardinality metrics, understand ingestion patterns, detect inefficient time series, and optimize your data pipeline.
This tool works with pre-aggregated statistics updated from the ingestion pipeline. Variations, labels, and trends reflect real-time ingestion data.
By regularly using the Metrics Usage Analyzer, observability teams can:
- Detect wasteful or unused metrics
- Reduce cardinality
- Control ingestion volume
Open the All metrics tab
- Go to Settings, then select Metric Data.
- The All metrics tab opens by default. The page also offers APM Metrics, for per-service usage of the APM spanmetrics, and Fair usage limits, for the ingestion and query quotas that apply to your account.
- Use the sub-tabs to explore:
- Metrics: Ingested metrics with usage, cardinality, and samples
- Labels: All labels attached to metrics
- Queries: Query patterns and usage across your metrics
Each sub-tab carries a Share link, which copies a link to the current view, and a Last Updated timestamp showing when the statistics were last refreshed.
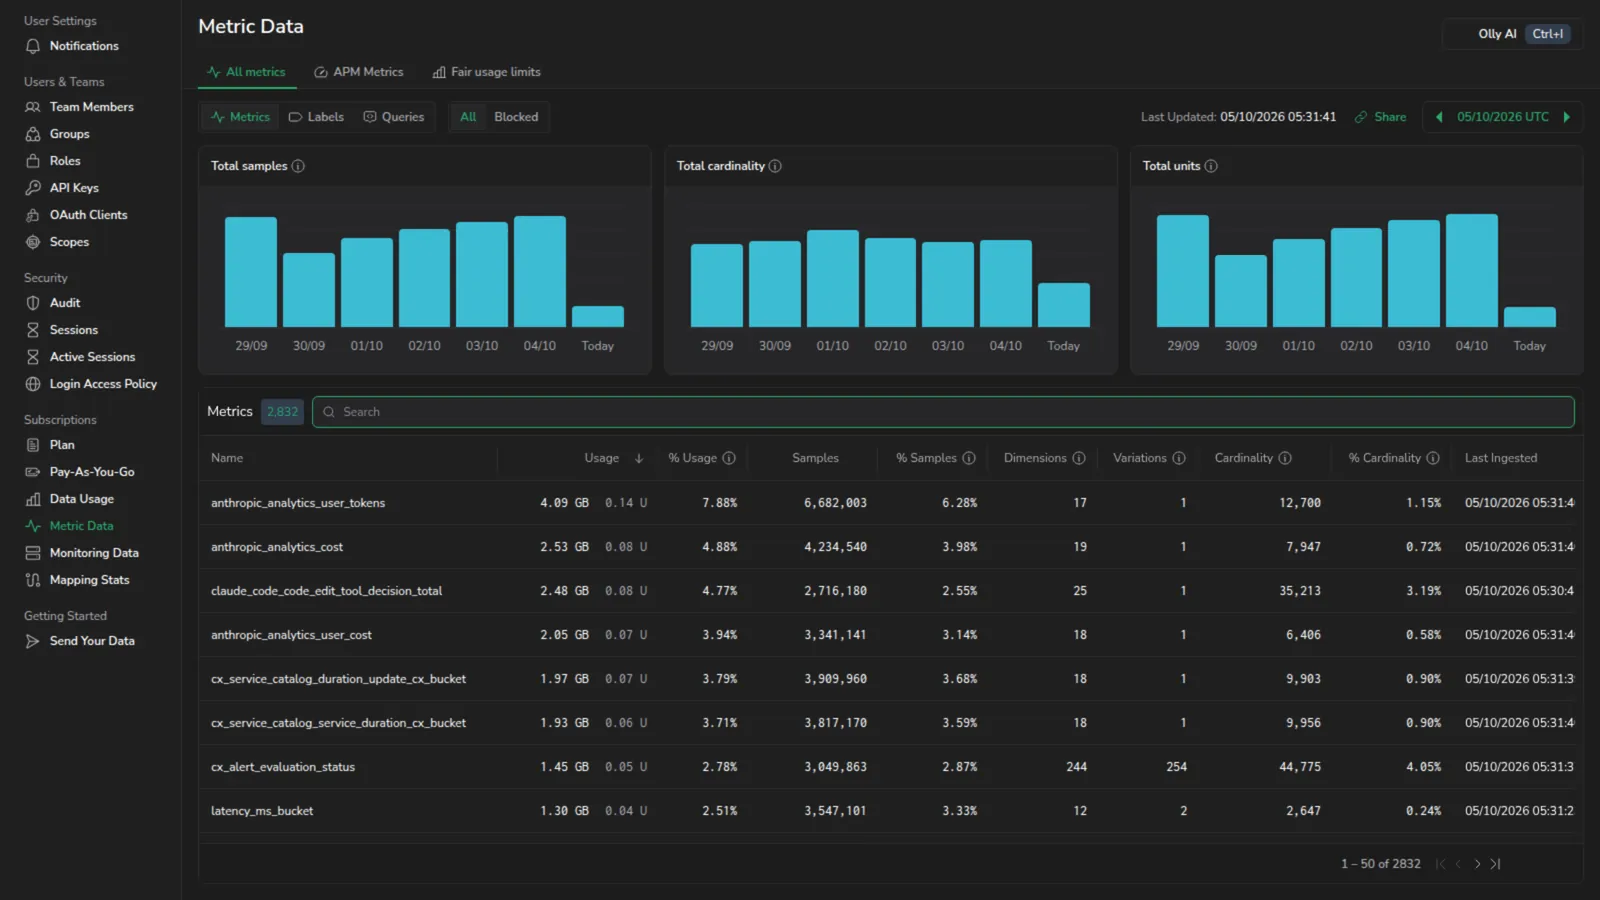
Displays the three usage charts above the metrics table, with the All and Blocked toggle beside the sub-tabs.
Review top-level usage
The Metrics sub-tab includes 3 charts that summarize ingestion and cost trends for the selected time range. Use these charts to understand how your metric volume and cardinality change over time:
-
Total samples: Shows how many metric data points were ingested.
Use this chart to spot ingestion spikes or drops that might indicate deployment issues, misconfigured scrapers, or unexpected increases in data volume.
-
Total cardinality: Shows how many unique time series were generated.
Use this chart to detect sudden growth in time-series count, often caused by new labels, unexpected label values, or high-cardinality dimensions such as pod_name or operation.
-
Total units: Shows the billing units generated by your metrics.
Use this chart to see how ingestion or cardinality changes influence your cost. A spike in units without a matching spike in samples often points to excessive cardinality.
These charts help you correlate ingestion patterns with cost, identify high-impact changes quickly, and prioritize where to reduce cardinality or remove unnecessary variations.
Read usage in bytes and CX units
Usage displays across Metric usage analysis show 2 values side by side:
- Bytes: Ingested data volume, formatted in KB, MB, or GB.
- CX units: Coralogix billing units derived from the ingested data, used to measure quota consumption.
Both values refer to the same ingestion period. Use bytes to reason about raw data volume and CX units to reason about billing impact. The pair appears in the top stats row of drilldowns and in usage columns across Metric usage analysis.
Explore the metrics table
The Metrics table lists usage details per metric. Key columns include:
- Usage: Data volume in bytes alongside CX units
- % Usage: Share of total usage
- Samples: Total datapoints ingested
- % Samples: Share of total samples
Sample counts might differ from PromQL results because Coralogix applies a 15-second deduplication window.
- Dimensions: Unique label keys
- Variations: Unique combinations of label keys
- Cardinality: Unique time series per metric
- % Cardinality: Share of total series cardinality
- Last Ingested: Timestamp of the most recent ingestion event for the metric
Variations reflect label set combinations. For example, (host, region) versus (host, app, region).
Coralogix estimates cardinality rather than counting every series, so Cardinality carries an error margin of about 1%. On a metric with 2 million series, expect the figure to land within roughly 20,000 either way. % Cardinality derives from the same estimate.
The margin is small enough to rank metrics, spot growth, and decide what to optimize, which is what these columns are for. It is too loose to reconcile against a billing figure or to assert an exact series count. When you need an exact number, use the Explore tab, which scans the full series set for the selected hour instead of estimating.
Drill into a specific metric
The drilldown opens with a top stats row that summarizes the selected metric for the chosen date:
- Cardinality: Unique time series for the metric.
- Usage: Ingested bytes alongside CX units.
- Samples: Datapoints ingested.
- Last updated: When these statistics were last refreshed.
The drilldown header shows the metric name with its ingestion status, and offers two actions:
- Query Usage Analyzer: Opens the Queries sub-tab with the metric name already entered as the search term, on the same date. Use it to see how a metric is queried before you decide to block it.
- Block Metric: Stops ingestion for the metric. For a metric that is already blocked, the button reads Unblock Metric. This action appears only if your role can update TCO policies.
Overview tab
The Overview tab visualizes daily ingestion trends and metric activity.
Panels
- Metric Unit Usage Per Day: Billing units ingested per day
- Variation Unit Usage Per Day: Usage trends per variation
- Label Unit Usage Per Day: Unit consumption per label
Display Modes
Use the Show control to switch every panel between:
- Unit Usage
- Data Volume
- Sample Count
- Cardinality
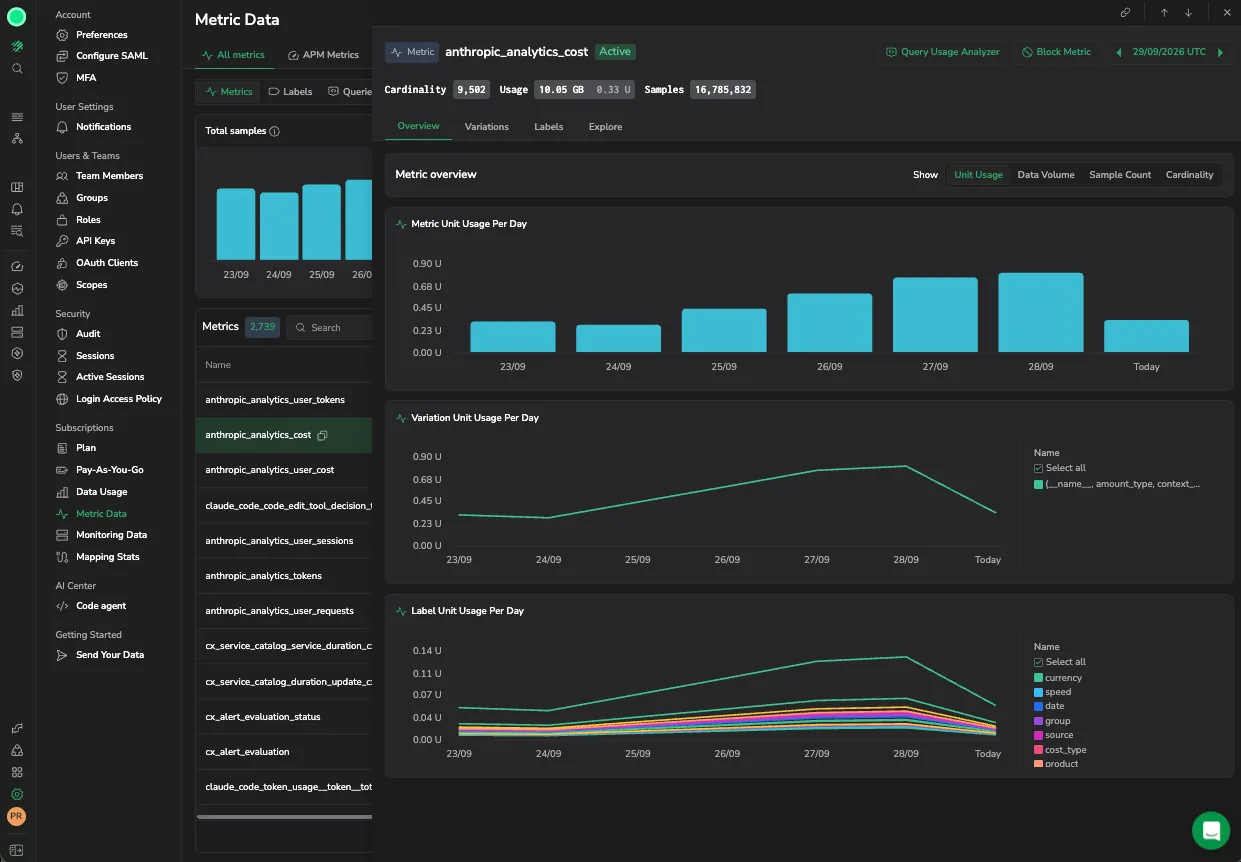
Shows the Show control above the daily usage panels for the metric, its variations, and its labels.
Insights
- Detect ingestion spikes or drops
- Identify inactive metrics
- Compare usage trends over time
Variations tab
The Variations tab breaks down how label combinations affect a metric's volume and cardinality. Use this view to identify which label sets consume the most storage and where to optimize.
For more details, see Variations.
Labels tab
The Labels tab analyzes label-level impact on storage and cardinality. Lists all labels attached to the metric with their usage, cardinality, and unique value count.
For more details, see Labels.
Explore tab
The Explore tab helps you identify which label values contribute most to a metric's cardinality. Drill down to see how individual label values affect the number of generated series and pinpoint which values are driving cardinality growth.
For more details, see Explore Tab.
Block noisy or unused metrics
In the Action column of the metrics table, select Block to stop ingesting a metric. You can also select Block Metric in the metric drilldown.
Blocking reduces both data volume and cost by preventing storage and queries of low-value metrics.
Unblock metrics when needed
The Metrics sub-tab carries an All and Blocked toggle next to the sub-tabs. The toggle appears only if your role can read TCO policies.
- Select Blocked to list the metrics currently blocked from ingestion.
- Select Unblock for any metric you want to resume ingesting.
Investigate label usage
In the Labels tab, you can:
- Search for a specific label (for example,
task_id) - View all metrics that use the label
- Investigate cardinality and value distribution for that label
Permissions
You must have the METRICS.DATA-ANALYTICS#HIGH:READ permission to access this section. For more information, see Create Roles and Permissions.
Related resources
- Data usage metrics. Exposes
cx_data_usage_unitsandcx_data_usage_bytes_totalso you can chart and alert on the same bytes and CX unit values in your own dashboards.