Data usage
Coralogix provides clear, flexible, and detailed insights into your observability data usage. Whether you manage logs, metrics, traces, or AI usage, consumption is measured in units — a consistent billing metric that gives you control over your data volume, cost, and performance.
This guide explains how Coralogix calculates, monitors, and reports data usage. Learn how to interpret usage statistics, understand your billing model, and use the Data Usage interface and reports to optimize your account.
Understand the unit-based pricing model
Coralogix employs a unit-based pricing model for its observability features.
A unit serves as a universal billing metric per entity type.
Entity types act as data types and objects across the Coralogix platform, breaking down observability pillars into more granular units.
| Pillar | Example entity types | Description |
|---|---|---|
| Logs | Browser logs, alerts | Event data from applications or user interactions |
| Metrics | Metrics | Numeric measurements of system performance |
| Traces | Spans | Detailed traces of operations and transactions |
| Binary | Session recordings, Source maps | Large binary objects, e.g., recordings or debug files |
| Profiles | CPU profiles | Continuous profiling data for performance analysis |
| AI | Olly, Evals, Guardrails | Per-user AI usage (Olly) and AI Center evaluations and guardrails. All AI features are billed in AI Units. See AI Units pricing. |
Ingested data flows through several TCO pipelines. Each pipeline’s TCO priority determines its unit cost. If no priority is assigned, the data is treated as high priority.
Usage is measured against your daily unit quota.
User data sent
User-defined datasets
Data routed to user-defined datasets counts toward your daily unit quota. Usage is tracked per dataset and per dataspace, so you can see how much each dataset consumes across the default/ dataspace.
The unit cost depends on the TCO priority of the routing policy applied to that dataset. The same rates as standard logs apply:
| Pipeline | Sent data | Units |
|---|---|---|
| Medium priority | 1 GB | 0.32 |
| Low priority | 1 GB | 0.12 |
Note
High and Block priorities are available for default/logs only. User-defined datasets do not support High or Block routing.
Dataset-level usage appears in the User data sent tab. Use the Slice and filter controls and select dataset as a breakdown field to see usage per dataset.
Logs
| Pipeline | Sent data | Units |
|---|---|---|
| High priority | 1 GB | 0.75 |
| Medium priority | 1 GB | 0.32 |
| Low priority | 1 GB | 0.12 |
| Blocked logs | 1 GB | 0.065 |
Blocked data counts as 8% of its original size to account for network ingestion overhead.
Metrics
| Pipeline | Sent data | Units |
|---|---|---|
| Metrics | 30 GB | 1 |
Traces
| Pipeline | Sent data | Units |
|---|---|---|
| High priority | 1 GB | 0.5 |
| Medium priority | 1 GB | 0.25 |
| Low priority | 1 GB | 0.1 |
1 unit = $1.50 of usage for logs, metrics, or traces in any pipeline.
System data sent
System data contains Coralogix-generated metadata related to your environment. When enabled, this data counts toward your daily quota.
Learn more about System datasets.
Infrastructure
Infrastructure events are telemetry signals collected from your cloud and Kubernetes environments, such as node statuses, pod lifecycle events, and configuration metadata. These are used to populate Infrastructure Explorer.
Blocked infrastructure events are those dropped before ingestion, usually due to namespace filters (e.g., excluding kube-system) or fair usage constraints.
| Pipeline | Sent data | Units |
|---|---|---|
| Infrastructure events | Any volume | 0 |
Learn more about Infrastructure Explorer.
AI Units
The AI Units tab tracks consumption for all AI-powered features — Olly, Olly Mini, and AI Center evaluations and guardrails — in one place. All AI features are billed in AI Units at per-model, per-token rates. Olly and Olly Mini bill per user; AI Center evaluations and guardrails bill per team.
For full rates and worked examples, see AI Units pricing.
The tab has three stacked sections:
- Total: combined daily AI Units consumption across per-user and AI Center usage
- Olly: per-user breakdown for Olly and Olly Mini usage: total units, monthly limit, max/min/avg daily, the daily usage chart, and the per-user Units breakdown table. Free teams also see a free-tier banner here.
- AI Center: policy-level breakdown for evaluations and guardrails. Policy names include their type — for example, Toxicity (Eval) or Prompt Injection (Guardrail) — so you can distinguish between them at a glance.
Each section can be collapsed independently.
Two admin controls apply:
- Team-wide limit: use Quota Rules to cap the team's total AI Units consumption on the
ollyentity type. - Per-user and automation limits: use Olly usage management to cap individual users and automations.
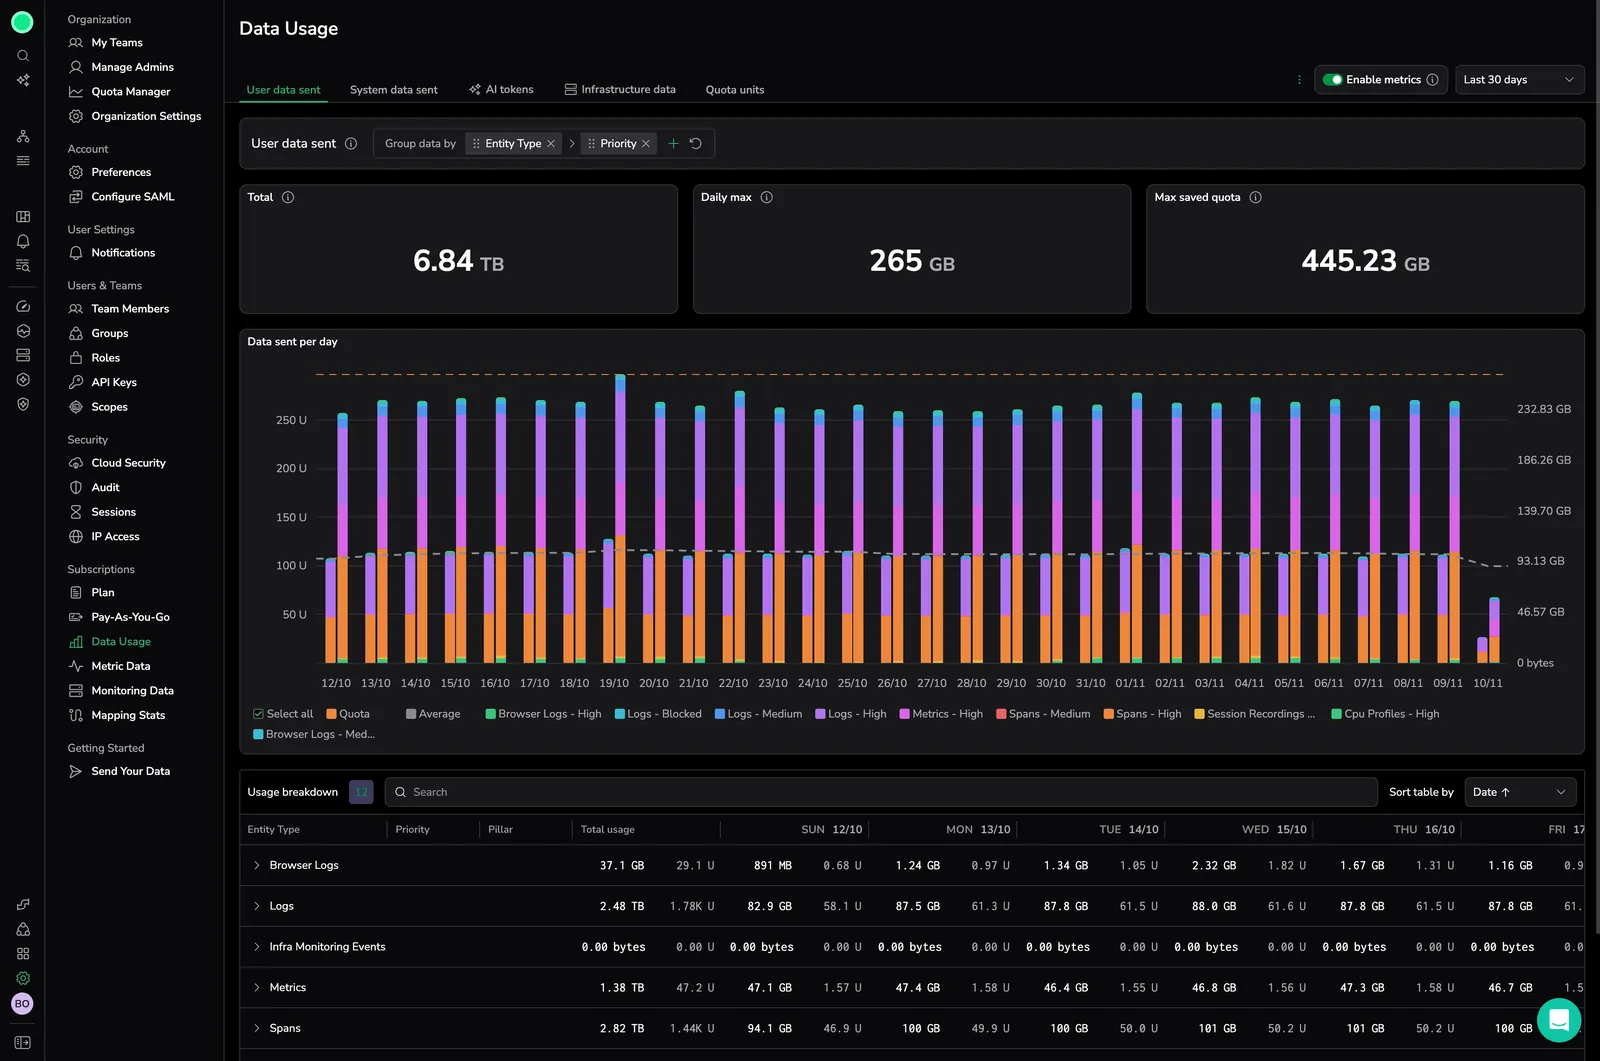
Monitor usage
The Data Usage interface shows real-time unit consumption across your Coralogix account.
Navigate to Settings, then Data Usage.
Time picker
Data Usage supports a full dynamic time selector, so you can choose a preset or set a custom date and time range to view and compare usage across any timeframe. This makes it easier to investigate spikes and anomalies in the exact period that matters and run accurate period-over-period comparisons for cost and quota planning.
To select a preset or custom time range for usage:
Open the time selector.
Choose a preset, or select Custom and set a date/time range.
Select Apply.
Visualizations and totals update for the selected period.
Usage tabs
The interface has six tabs:
- User data sent: Total ingested user-generated data, including user-defined datasets
- System data sent: Total system-generated data, such as alert history, audit events, and schema metadata
- AI Units: Combined AI usage from Olly (per-user) and AI Center (evaluations and guardrails), with sub-sections for Total, Olly, and AI Center
- Infrastructure data: Infrastructure events
- Quota units: Daily unit consumption
- Metric usage: Metric sample consumption (when available on your account)
Usage statistics
Each tab displays a row of counter cards summarizing consumption over the selected period. Cards vary by tab, and quota-scoped tabs show additional cards that put usage in context against your daily quota.
Quota units and User data sent tabs
The Quota units and User data sent tabs show eight cards:
| Card | Description |
|---|---|
| Daily quota | Your team's allocated daily unit quota |
| Current usage | Average daily usage in the selected period |
| Blocked days | Number of days with blocked data due to quota limits |
| Blocked units (est.) | Estimated units blocked due to quota limits |
| Max daily usage | Highest daily ingested volume, with a trend badge comparing the second half of the period to the first half |
| Min daily usage | Lowest daily ingested volume, with a trend badge comparing the second half of the period to the first half |
| Avg daily usage | Average daily ingested volume, with a trend badge comparing the second half of the period to the first half |
| PAYG usage total | Total pay-as-you-go usage in the selected period |
Other tabs
The System data sent, AI Units, Infrastructure data, and metric sample scopes (when available on your account) show four cards:
| Card | Description |
|---|---|
| Total | Total usage in the selected period |
| Max daily usage | Highest daily ingested volume, with a trend badge |
| Min daily usage | Lowest daily ingested volume, with a trend badge |
| Avg daily usage | Average daily ingested volume, with a trend badge |
Trend badges
The Max daily usage, Min daily usage, and Avg daily usage cards display a trend badge that compares the second half of the selected period to the first half. An upward arrow indicates the value increased; a downward arrow indicates it decreased. The percentage shows the relative change between the two halves, helping you spot rising or declining usage at a glance.
Hover over any card label to see a tooltip with a short description of the metric.
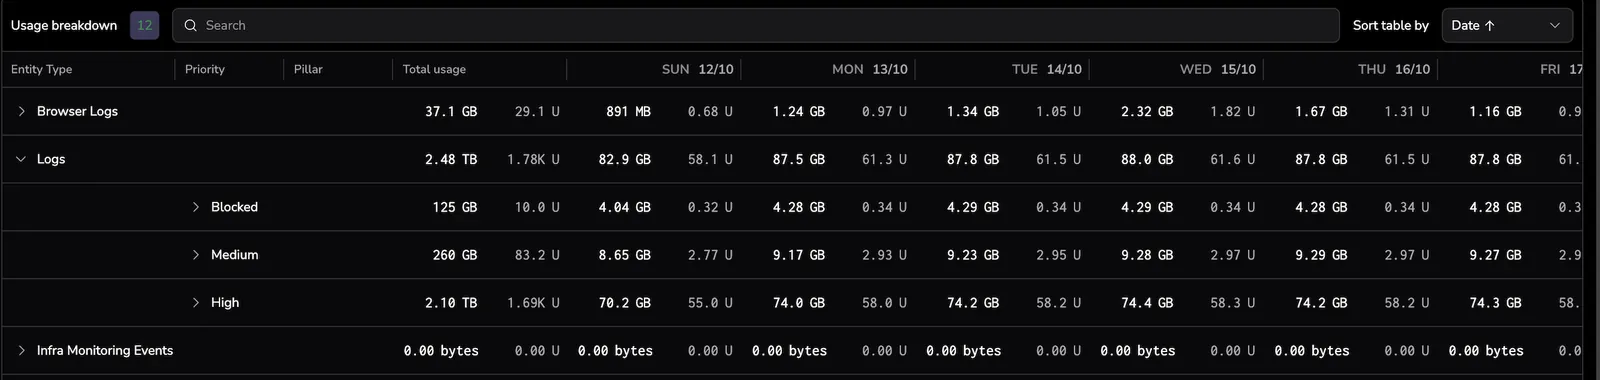
Units per entity type
Hover over columns in the bar chart to view unit distribution by day, or scroll to the breakdown grid for detailed totals by entity type.
Units breakdown
Each entity type shows:
- Total units and percentage of total usage
- Volume of ingested data
Slice and filter the data
Choose fields (e.g., pillar, entity type, TCO priority, dataset, dataspace) to include in the breakdown. Drag chips to rearrange them.
Enhance observability with data usage metrics
Enable Data Usage Metrics to view real-time usage patterns. Build dashboards, set alerts, and generate summaries.
You can toggle metrics ingestion and the dataplan.usage_events system dataset from the Data Usage settings panel.
Generate and export usage reports
Generate custom usage reports directly from the Data Usage interface. Configure the file name, date range, scope, format, and report type to match your analysis or audit workflow.
To open the export dialog, select Generate report from the Data Usage page header.
Choose a report type
The Generate report drawer opens with a Report type selector:
- Data usage report — the standard usage export. This is the default and uses the configuration described below.
- Focus report — a FOCUS v1.3 compliant export of your billing data, ready to ingest into FinOps tools. See Focus report.
- Pay-as-you-go report — a per-day export of your pay-as-you-go (overage) unit consumption. This option appears only for teams with pay-as-you-go enabled. See Pay-as-you-go report.
Selecting a different report type replaces the form in place with that report's fields. Switching back restores each report's configuration without closing the drawer.
Configure the report
The following options apply to the Data usage report type.
| Field | Description |
|---|---|
| File name | Editable base name for the exported file. The default follows data-usage-[scope]-[from_date]_[to_date]-[timestamp], and regenerates as you change the scope or date range until you edit the value manually. |
| Date range | Preset window for the report: Current month, Last 30 days, or Last 90 days. The maximum range is 90 days. |
| Tabs | One or more Data Usage tabs to include. Tabs available in the dialog mirror the tabs visible in your Data Usage page; some tabs depend on your plan or enabled features. Available tabs also depend on the selected report type. |
| Export as | File format: CSV, TSV, or JSON. |
| Include headers | Adds column names as the first row of the exported file. Available for CSV and TSV formats only. |
| Type | Overview report or Detailed report. See the sections below. |
| Apply filters | Applies the current Data Usage table filters and grouping to the exported data. Available for Overview reports when a single tab is selected. |
Overview and detailed reports
Overview report
Exports the summarized metrics visible on each selected tab, including total usage, daily max, and quota usage for the selected date range. Overview reports support the Apply filters option, which carries over the filters and grouping configuration from the Data Usage page.
Overview exports support the User data sent, System data sent, Olly and AI Center (the AI Units sub-scopes, exported separately), Infrastructure data, Metrics samples (when available on your account), and Quota units tabs.
Detailed report
Exports the full daily breakdown per entity type or data pillar, including all available metrics. Detailed reports include the full daily breakdown with no row limit.
Detailed exports support the User data sent, System data sent, AI Center, Infrastructure data, and Olly tabs.
Export formats and bundling
- A single-tab export produces one file in the chosen format.
- A multi-tab CSV or TSV export bundles one file per tab into a
.ziparchive. - A multi-tab JSON export produces a single hierarchical JSON file containing each tab as a nested object.
CSV and TSV columns
CSV and TSV exports include the following columns, depending on the selected tab:
- Date
- Application
- Subsystem
- TCO priority
- Entity type
- Dataset
- Dataspace
- Ingested data (GB sent)
- Unit consumption
Focus report
A Focus report exports your data usage in the FOCUS v1.3 format — the FinOps Open Cost and Usage Specification that cost-management and FinOps tools ingest directly. Use it to bring Coralogix billing data into the same reporting pipeline as your other cloud and SaaS spend, without manual transformation.
When you select Focus report in the Report type selector, the drawer shows a focused form:
| Field | Description |
|---|---|
| File name | Editable base name for the exported file, pre-filled from the selected date range. |
| Date range | The period to export. The range must be between 1 and 365 days, and the start date must be on or before the end date. |
The FOCUS export covers your account in a single region, so there are no scope, format, header, or filter options to configure.
Select Export to generate and download the report. Coralogix streams the data and packages it as a zipped CSV. While the export runs, the Export button shows a loading state. If it fails — for example, an invalid date range or a permission issue — the drawer stays open with an error message so you can correct the input and retry without reopening it.
Generating a Focus report needs no extra permission or feature flag — any user who can view Data Usage can create one.
Pay-as-you-go report
A Pay-as-you-go report exports your pay-as-you-go (overage) unit consumption — the usage billed above your daily quota. The report type appears in the Report type selector only for teams that have pay-as-you-go enabled.
Pay-as-you-go usage is calculated against your team quota pool as a single daily total, so the report has no entity-type, priority, or pillar breakdown. When you select Pay-as-you-go report, the drawer shows these fields:
| Field | Description |
|---|---|
| File name | Editable base name for the exported file, pre-filled from the selected date range. |
| Date range | The period to export. |
| Export as | File format: CSV, TSV, or JSON. |
| Include headers | Adds column names as the first row of the exported file. Available for CSV and TSV formats only. |
| Type | Overview report or Detailed report. A detailed report lists per-day pay-as-you-go units (date and units), with no entity, priority, or pillar columns. |
The exported values reconcile with the PAYG usage total shown on the Data Usage page for the same date range.
Data Usage Service API
Reports are also available programmatically through the Data Usage Service API.
Permissions
To access Data Usage, the following permissions are required:
| Resource | Action | Description |
|---|---|---|
data-usage | manage | Manage Data Usage |
data-usage | read | View Data Usage |